Influenza
Influenza
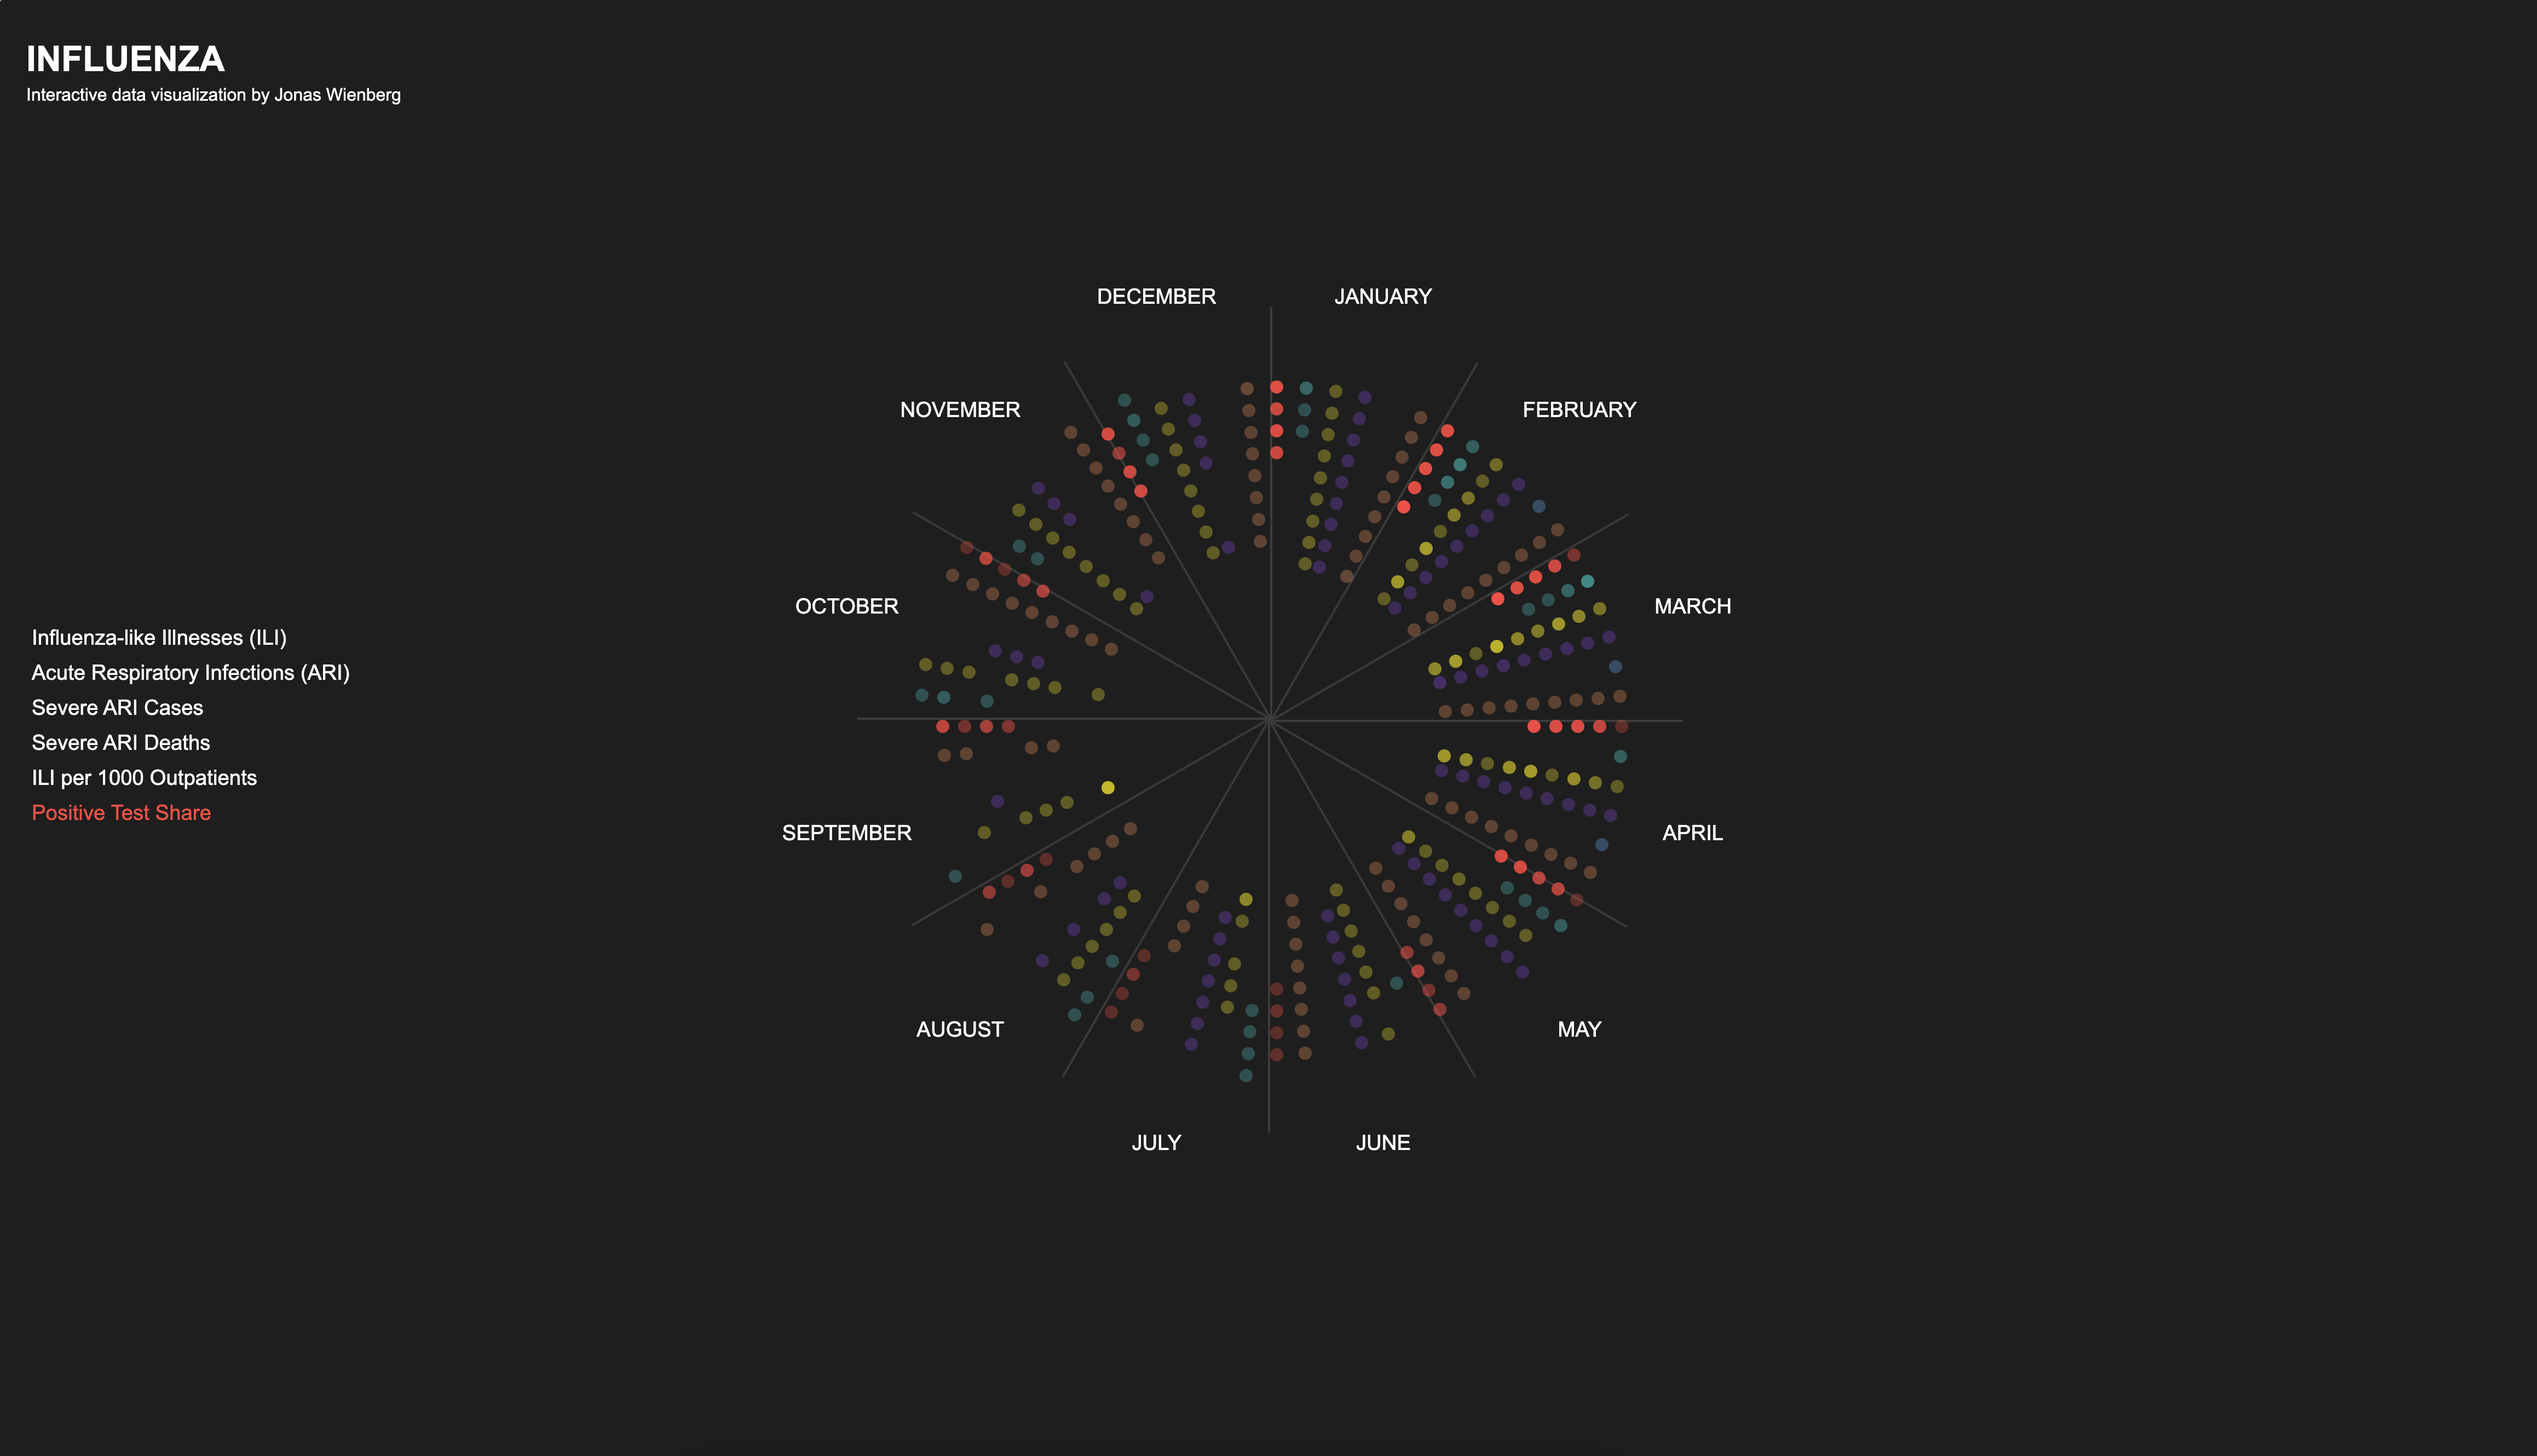
→Jonas WienbergThe interactive data visualization presents the global distribution of influenza cases from 2009 to 2024. The visualization is designed to provide insights into the seasonal patterns of influenza globally, aiding in better understanding the disease.
Programmiertes Entwerfen 2
IG2
Prof. Hartmut Bohnacker
Benjamin Thomsen
Data Sources

The aim of this project is to develop an interactive data visualisation that presents the distribution and intensity of influenza cases across six distinct countries: Germany, Iceland, UAE, Iran, North Korea, and Japan. This visualisation will explore the impact of regional temperatures and geographical differences on the spread and severity of influenza.
Goals
Data Aggregation: Collect and compile comprehensive data on influenza cases from the specified countries.
Regional Analysis: Examine how geographical and climatic differences alter the spread and severity of influenza.
Comparative Study: Highlight the contrasts and similarities in influenza impact among countries with diverse climates and locations.
Interactive Elements: Enable users to interact with the data to explore trends and patterns dynamically.
Course examples


Data
The dataset used for this project is extensive, encompassing a vast array of influenza-related data collected from multiple reliable sources, including FluNet by the World Health Organization (WHO), the Global Influenza Surveillance and Response System (GISRS), and Our World in Data. This comprehensive dataset includes numerous variables and spans several years (2009–2024), covering various countries and regions globally.
Given the large size and complexity of the dataset, it was essential to focus on the most critical data points to ensure the visualization remains clear and informative. After careful consideration, the following six key data points were selected for their relevance and ability to provide a comprehensive overview of influenza cases and their impact:
-
Reported Cases of Acute Respiratory Infections: This data point captures the number of acute respiratory infections reported, providing insight into the prevalence of respiratory illnesses that may be associated with influenza.
-
Reported Cases of Severe Acute Respiratory Infections: This metric highlights the severity of respiratory infections, indicating the number of severe cases that require more intensive medical attention.
-
Reported Cases of Influenza-like Illnesses: This data point includes cases that exhibit symptoms similar to influenza, helping to understand the broader impact of influenza-like illnesses.
-
Reported Deaths Caused by Severe Acute Respiratory Infections: This critical data point tracks the mortality rate associated with severe respiratory infections, offering a measure of the lethality of influenza outbreaks.
-
Reported Cases of Influenza-like Illness per Thousand Outpatients: This normalized metric allows for comparison across different regions and populations by showing the rate of influenza-like illnesses per thousand outpatients.
-
Reported Cases of Severe Acute Respiratory Illness per Thousand Outpatients: Similar to the previous metric, this data point provides a normalized view of severe respiratory illnesses per thousand outpatients, facilitating comparative analysis.
For readability purposes, these data points were relabeled in the data visualization to ensure clarity and ease of understanding for the users.
Scope
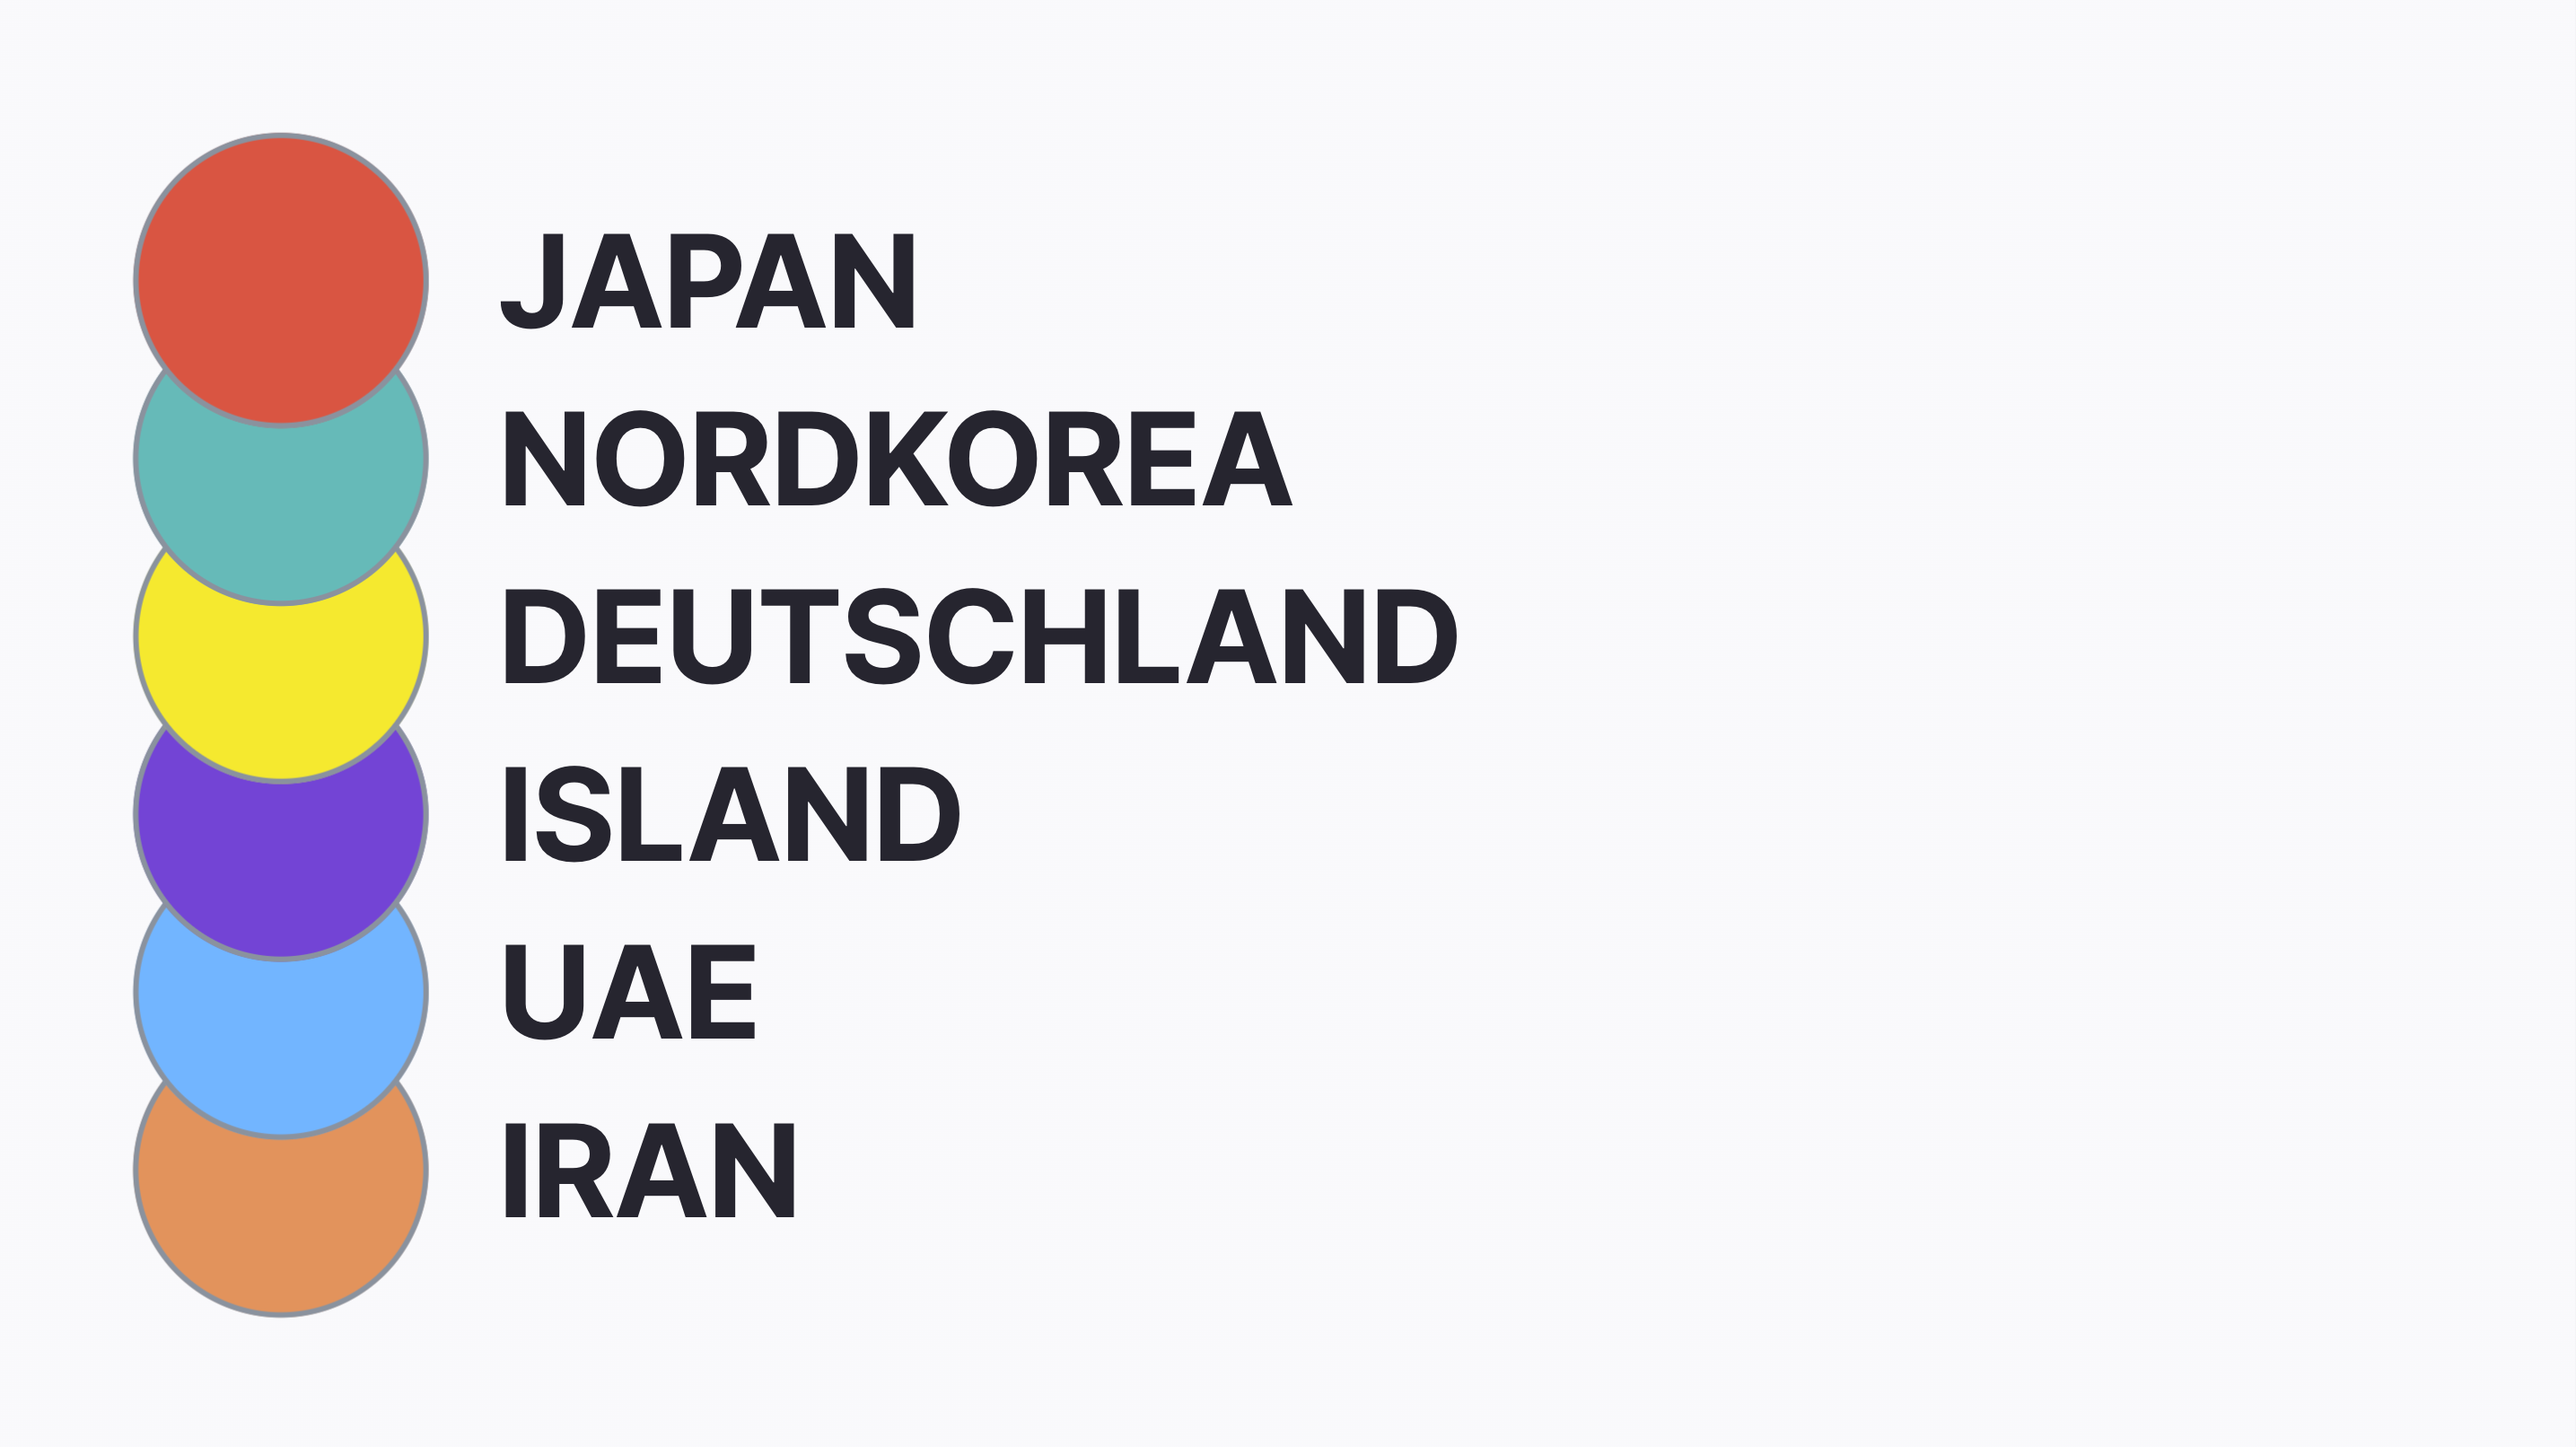
Countries Covered: Germany, Iceland, UAE, Iran, North Korea, and Japan.
Data Points: Number of influenza cases, casualties, and impacted individuals.
Variables: Regional temperatures and climatic conditions.