Technical Implementation
Languages
— .js — JavaScript
Libraries
— gmynd.js — j.query 3.7.1
Data set size
— 49,890 rows (adjusted) — 96,875 rows (all countries)
Lines of code
— 754
Dataset Size
The dataset used in this project is substantial, comprising:
49,890 rows of cleaned data specifically for the selected countries (Germany, Iceland, UAE, Iran, North Korea, and Japan).
96,875 rows of data, encompassing all countries included in the original dataset.
Lines of Code
The project consists of 754 lines of code, meticulously written to handle data processing, visualization, and user interaction.
Code Structure and Functionality
The code is structured to ensure efficient data handling and visualization:
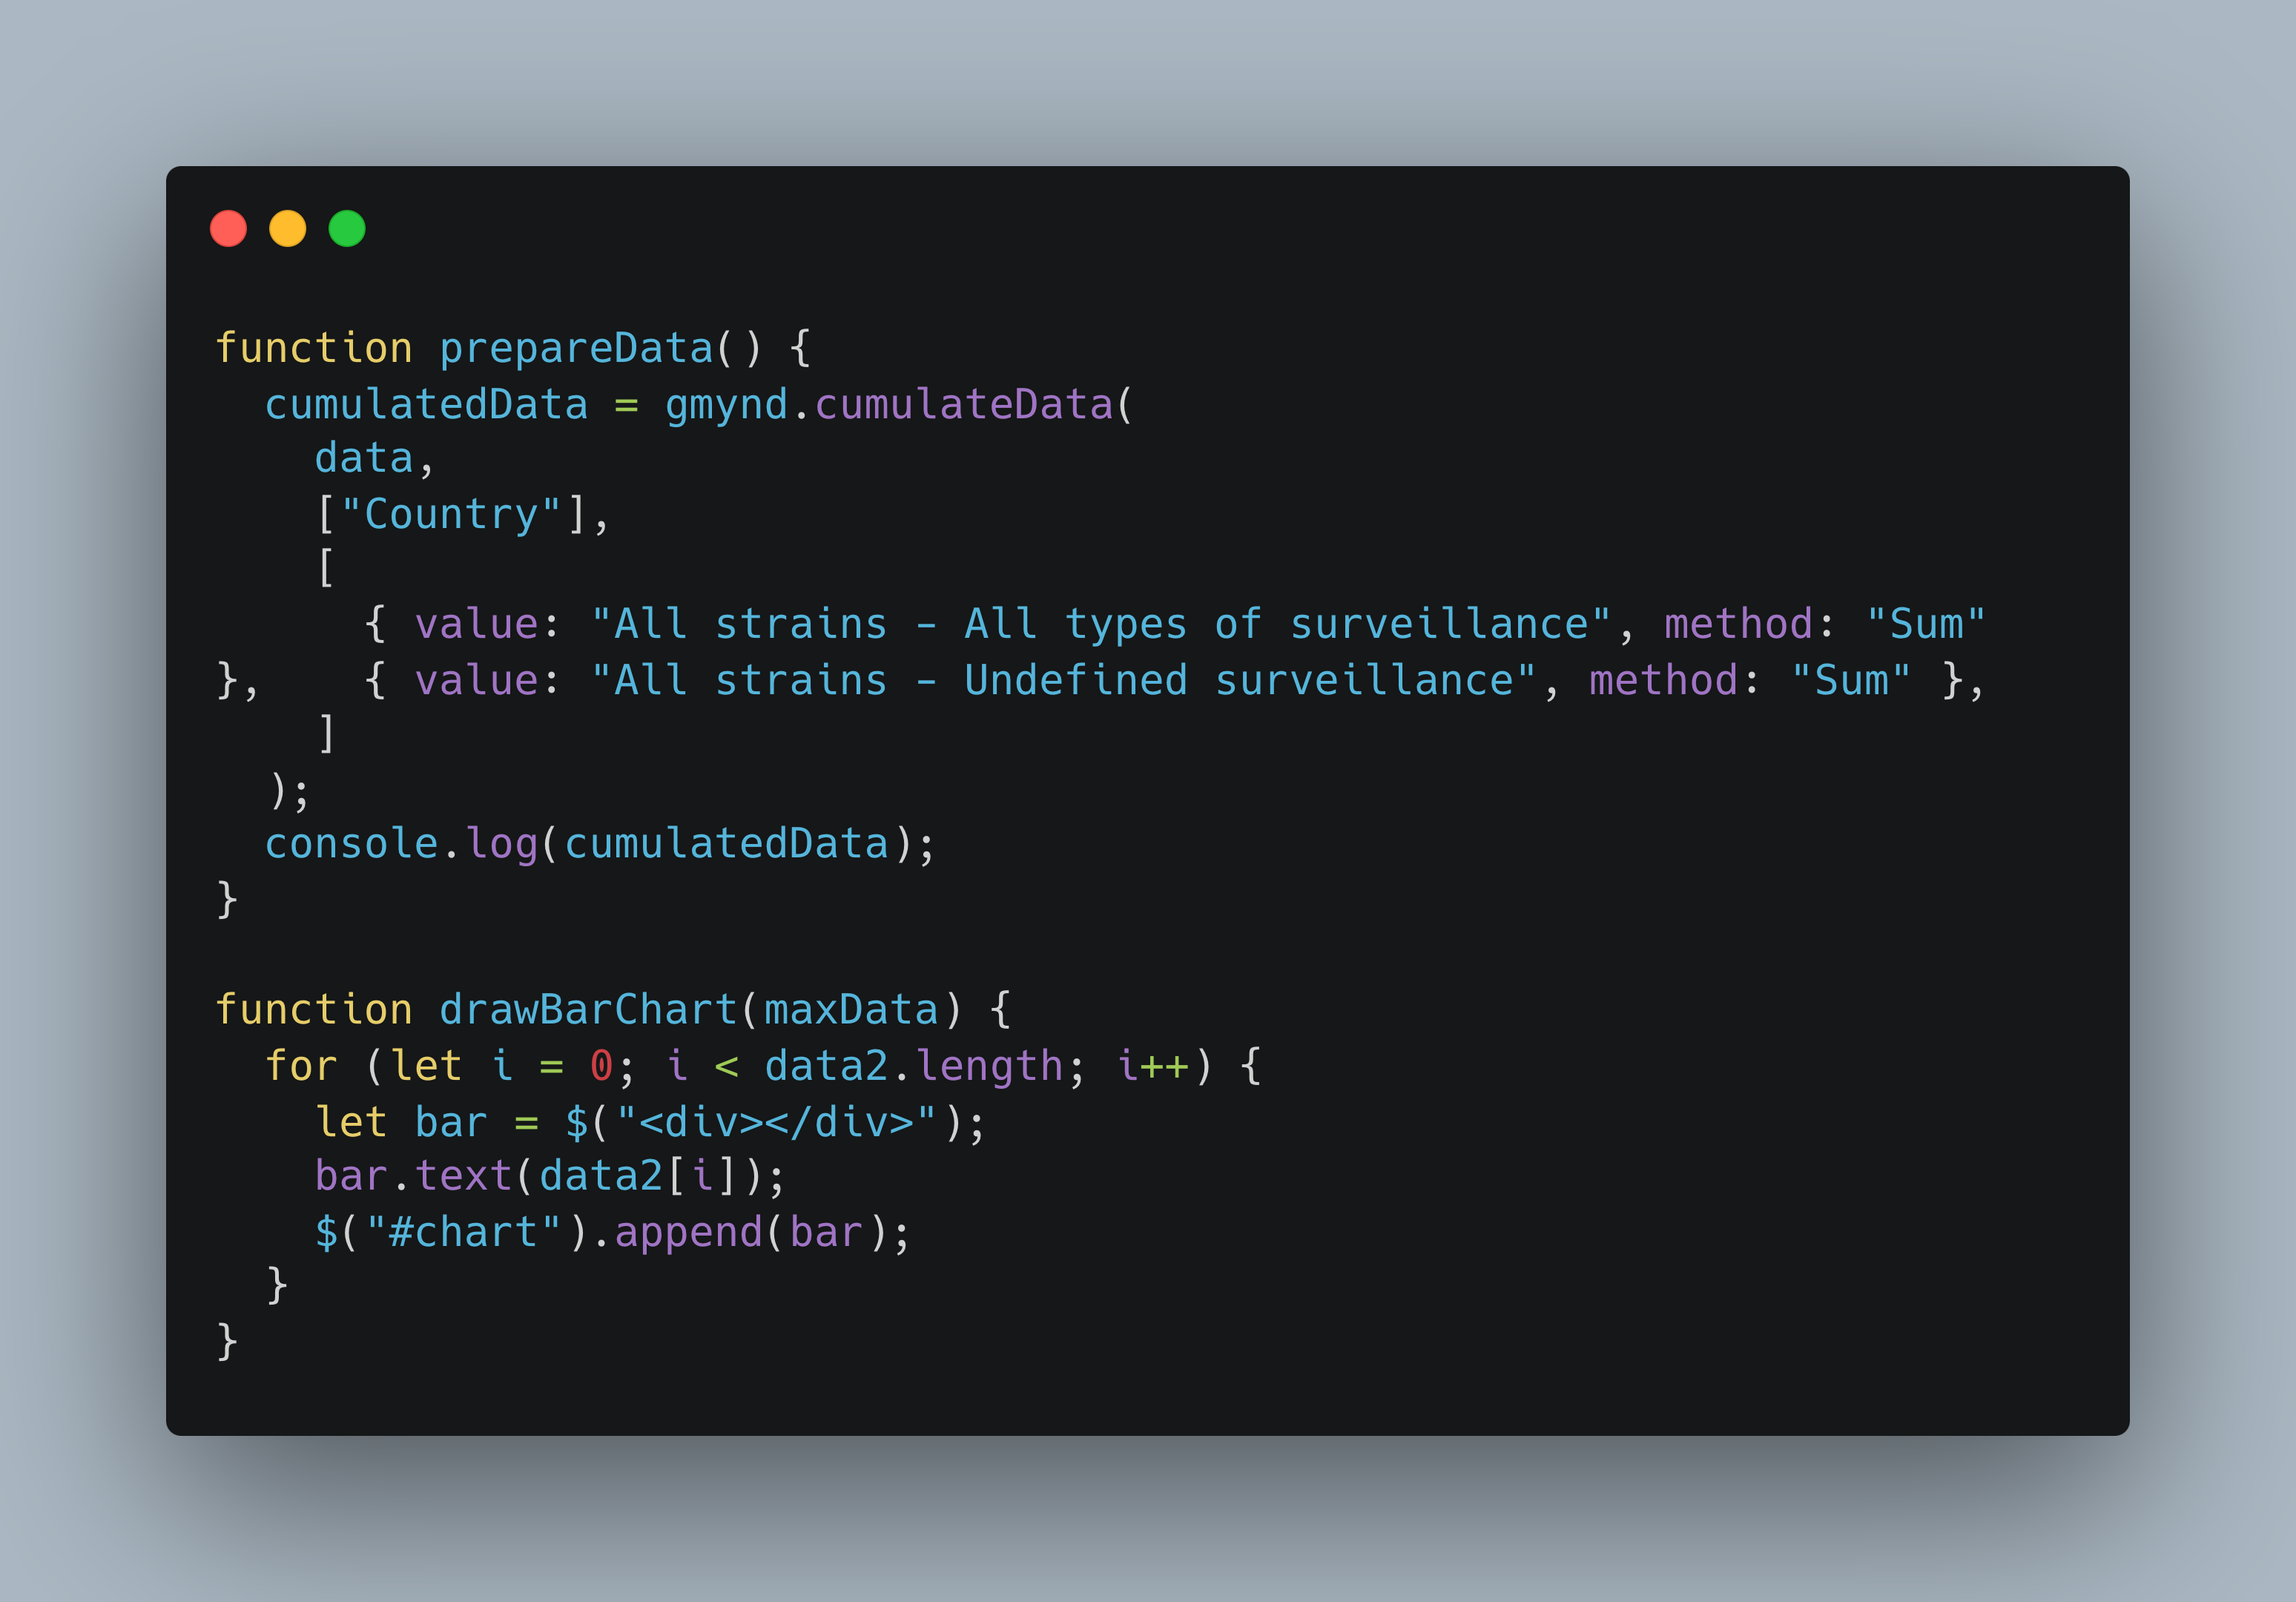
Data Preparation:
Functions like prepareData() are used to process and aggregate data, ensuring it is ready for visualization.
Visualization:
Functions such as drawBarChart(maxData) are implemented to create dynamic and interactive visual elements.
User Interaction:
jQuery is utilized to enhance user interaction, allowing users to filter and explore data dynamically.
Additional Code Aspects
Error Handling:
Robust error handling mechanisms are incorporated to manage potential issues during data processing and visualization. This ensures the application remains stable and provides meaningful error messages to the user.
Performance Optimization:
The code includes performance optimization techniques, such as data caching and efficient DOM manipulation, to ensure smooth and responsive user experiences even with large datasets.
Modular Design:
The codebase follows a modular design pattern, breaking down functionality into reusable components. This enhances maintainability and scalability, allowing for easy updates and feature additions in the future.
Data Inconsistencies:
Addressed by standardizing date formats and ensuring all data points are complete.
Visualization Complexity:
Simplified by using clear color codes and interactive elements to enhance user experience.
Interactive Elements:
Users can hover over data points to see detailed information about each case.
Visualization Features
Interactive Elements: Users can hover over data points to see detailed information about each case.
Color Coding: Different colors represent various data points (ILI, confirmed cases, hospitalizations, deaths). The intensity of the color indicates the number of cases.
Challenges and Solutions
Data Inconsistencies: Addressed by standardizing date formats and ensuring all data points are complete.
Visualization Complexity: Simplified by using clear color codes and interactive elements to enhance user experience.