Formula 1 Incidents
Formula 1 Incidents
→Helen FrankIn the following chapters, I will discuss the process of the work, address problems and difficulties and explain my design process for the individual visualisations. Furthermore, the technical realisation and its problems will be explained in this documentation.
Programmiertes Entwerfen 2
IG2
Prof. Hartmut Bohnacker
Benjamin Thomsen
data
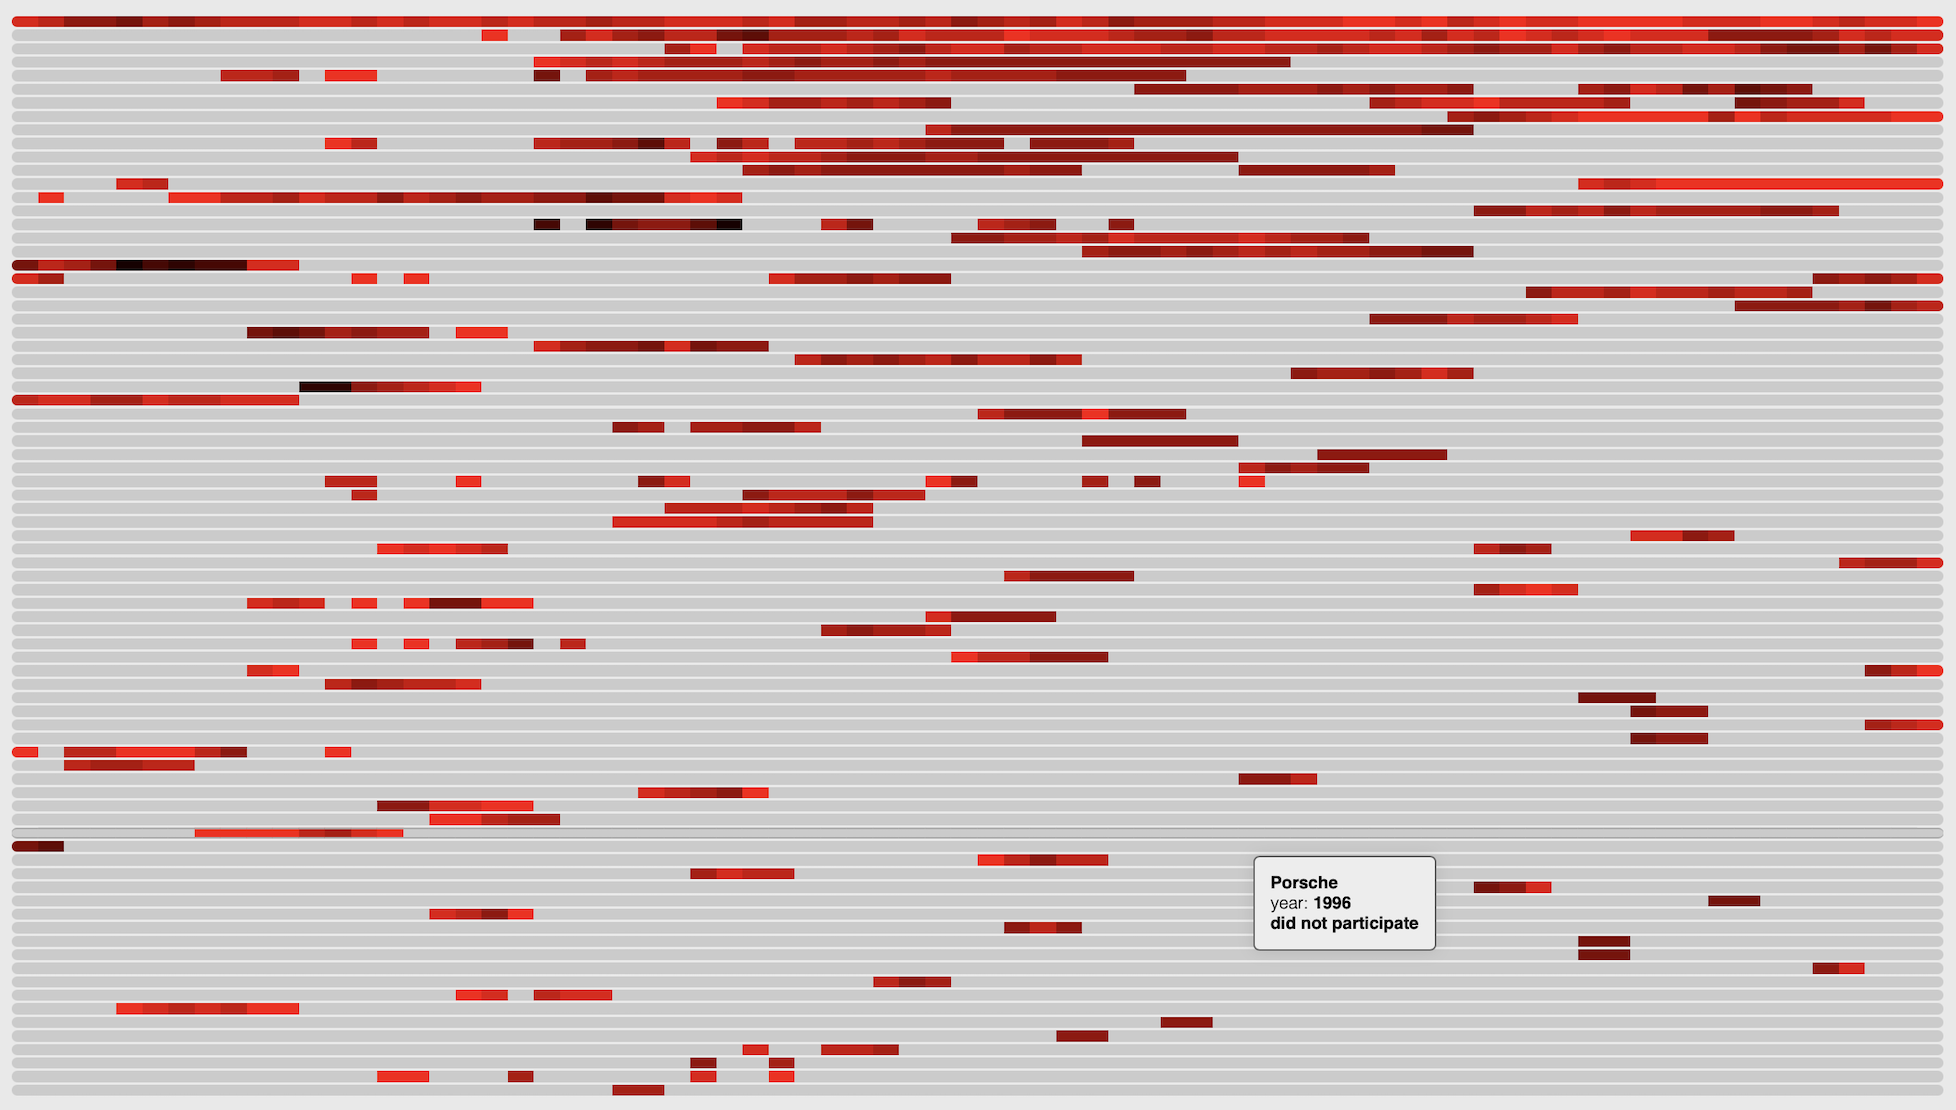
Formula 1 is a high-risk motorsport in which numerous problems and incidents can have a significant impact on the race and can be dangerous. Technical defects in the engine, electronics or suspension occur just as much as human errors, for example due to incorrect judgements, overconfidence or lack of concentration on the part of the drivers. Strategic mistakes or incorrect pit stops by the team can also have a negative impact on the race. Both technical and human problems can bring the race to an abrupt end and cause dangerous situations.
During an incident on the race track at the 2012 Karting World Championship in Italy, the opinions of the two racing drivers Max Verstappen and Charles Leclerc differed greatly. What one driver described as an unfair race, the other described as “just an incident”. Both drivers still race against each other today.
The dataset on kaggle.com contains Formula 1 data from 1950 to 2023 and consists of 14 files with a total of 120 columns covering all aspects of Formula 1 results. This dataset offers many opportunities to gain comprehensive and specific information. The first task was to decide which specific data to use.

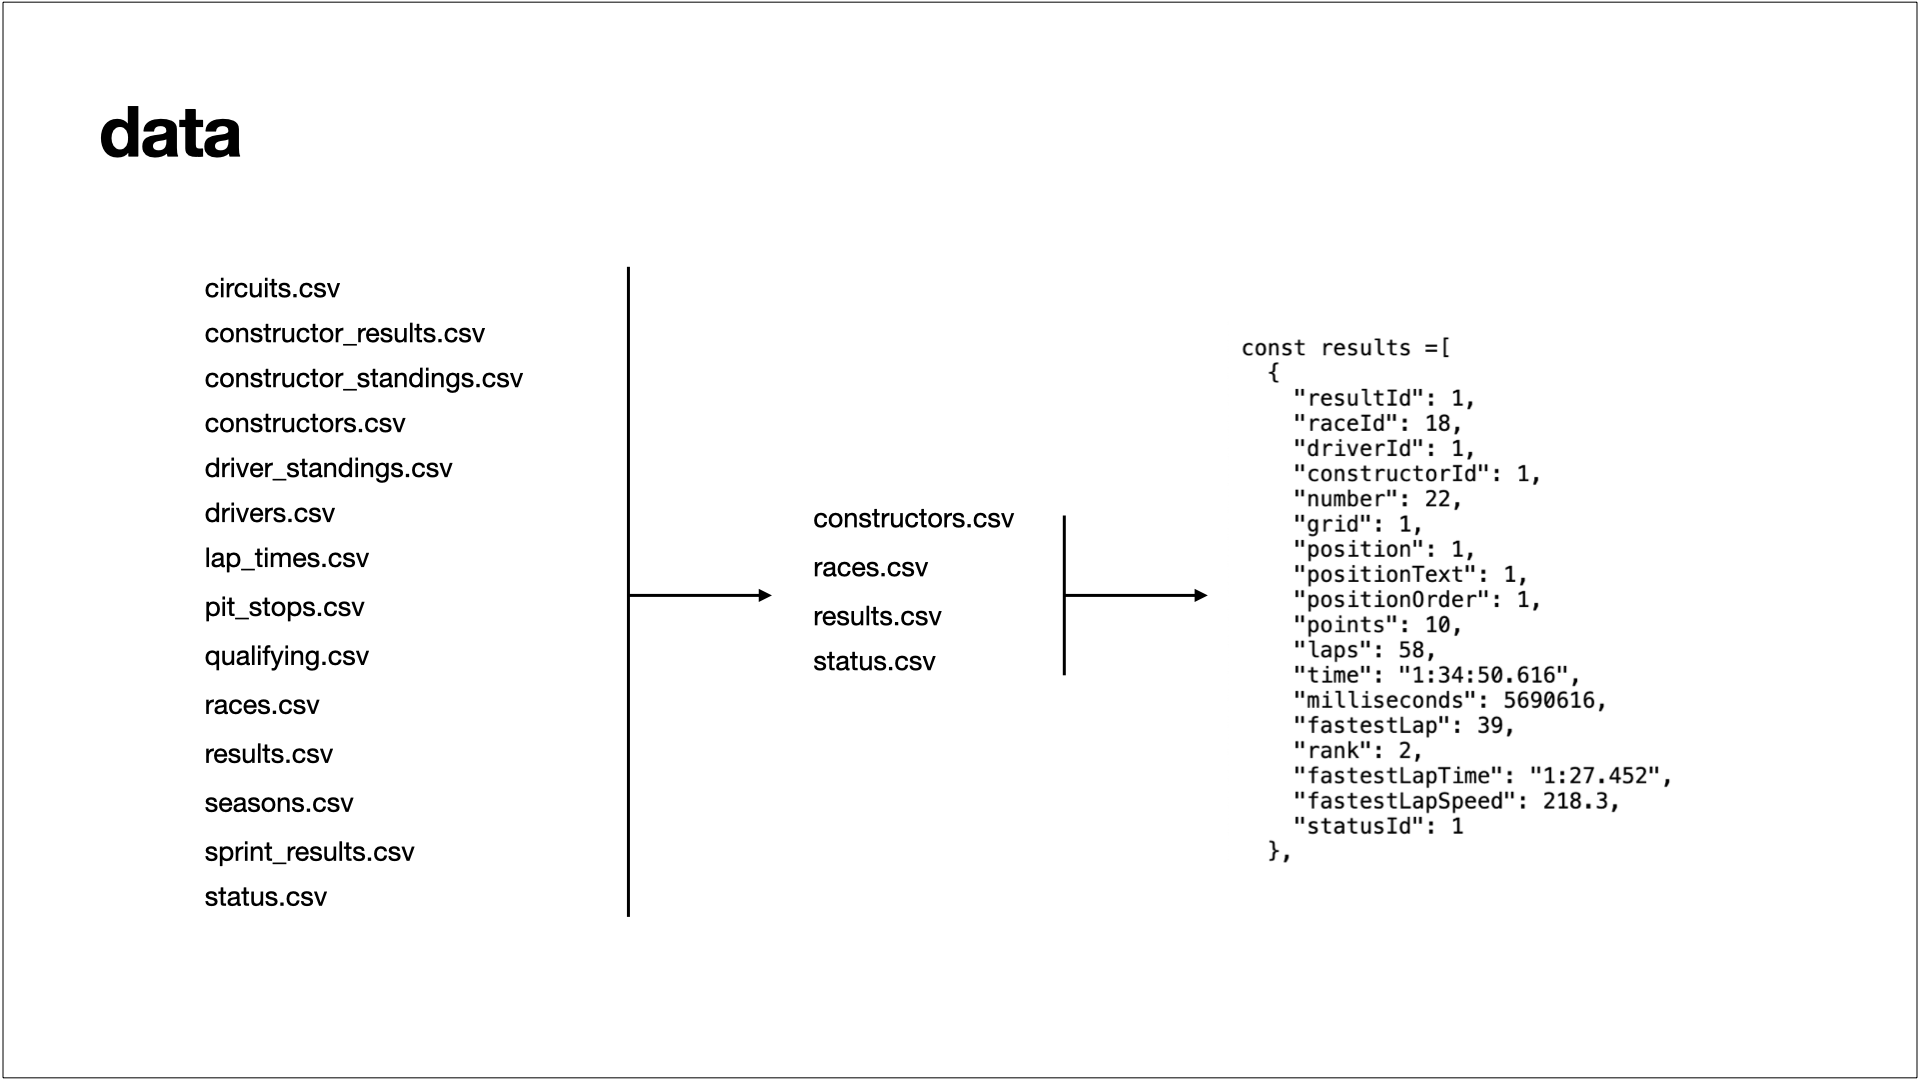
These are the individual files that the data set includes. The task now was to find out which data set is to be used and which data sets need to be linked for this purpose.
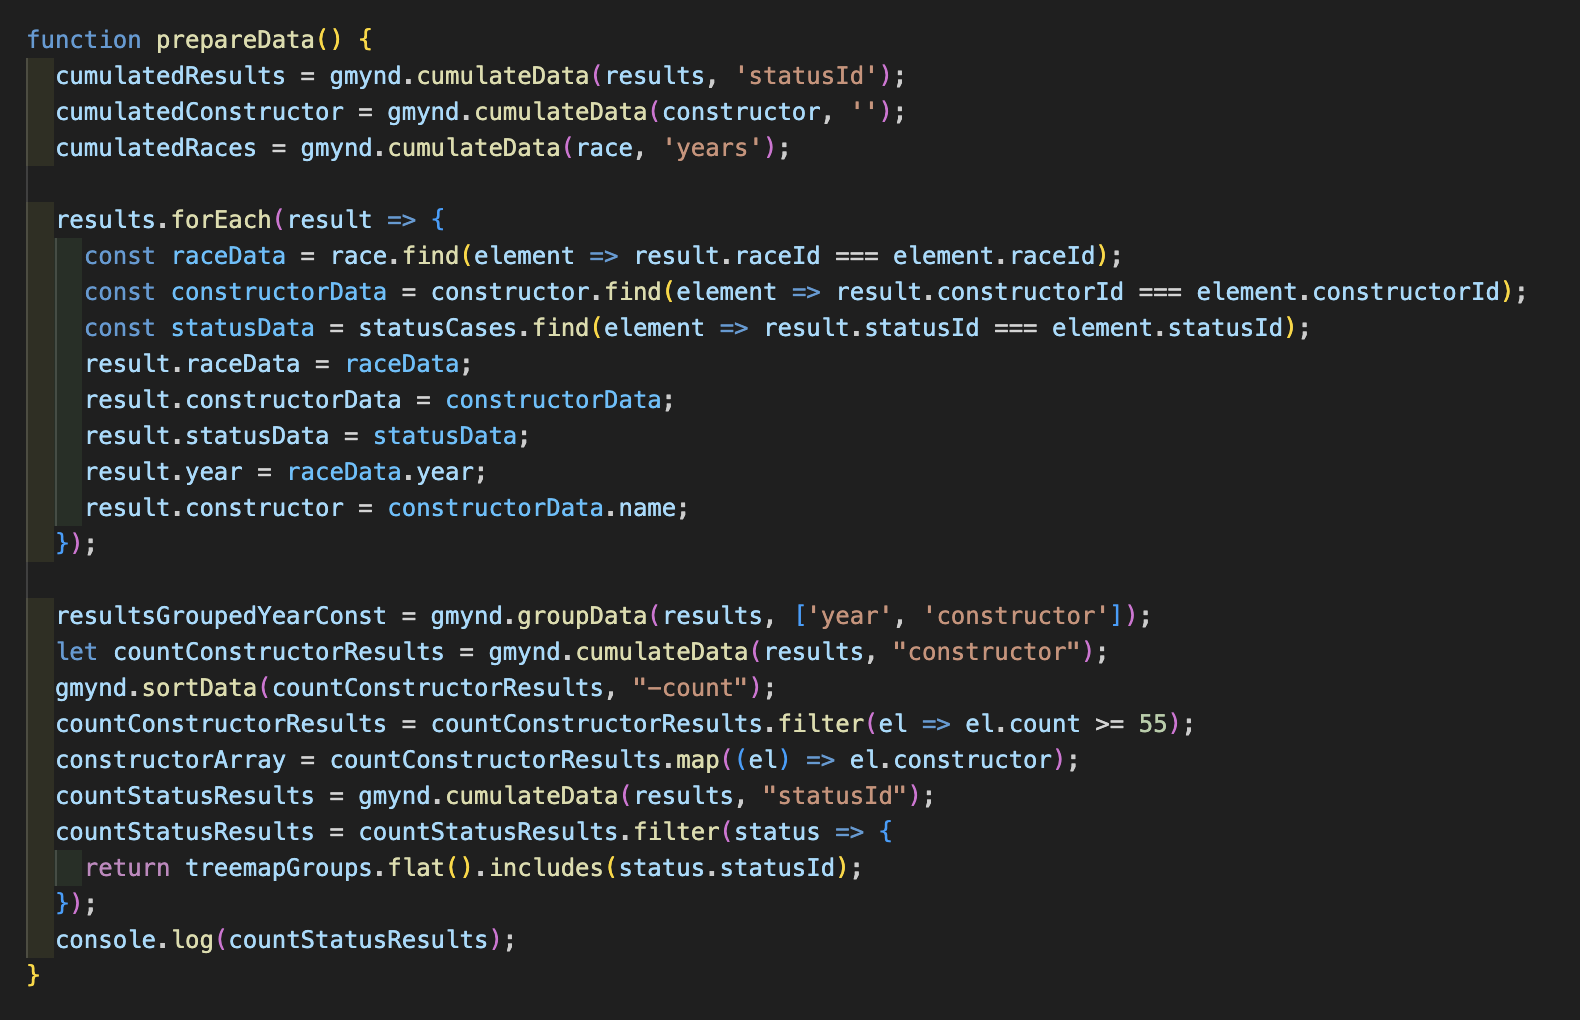
In addition to the individual statuses, the results, constructors and races were also required to merge the statuses. Together from these 4 data sets, the relevant information could be filtered out as required.
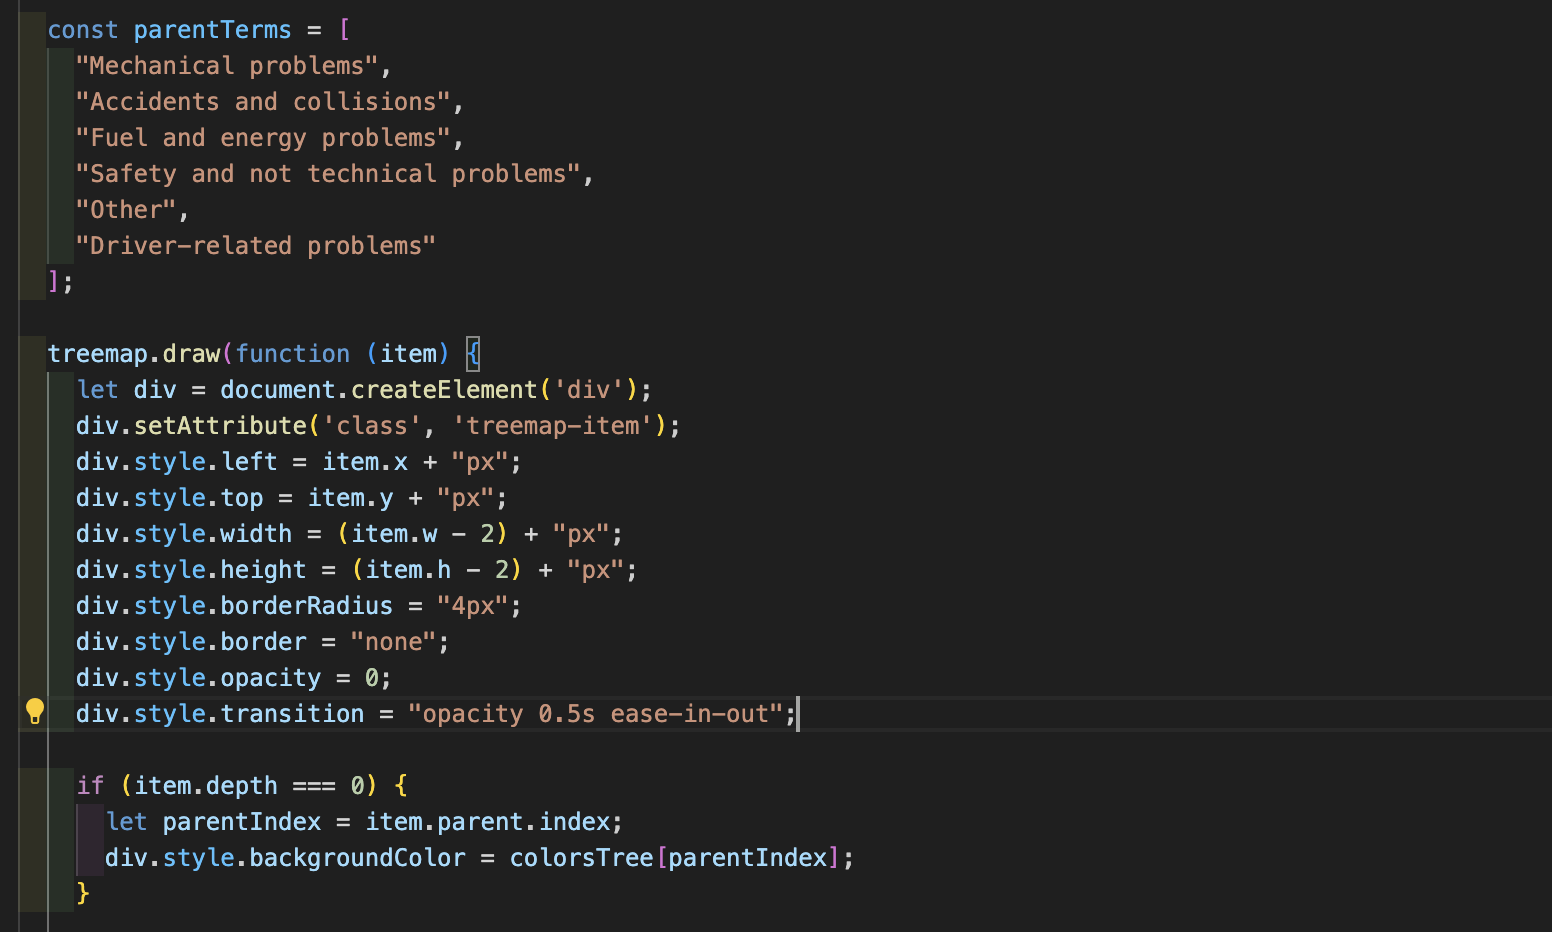
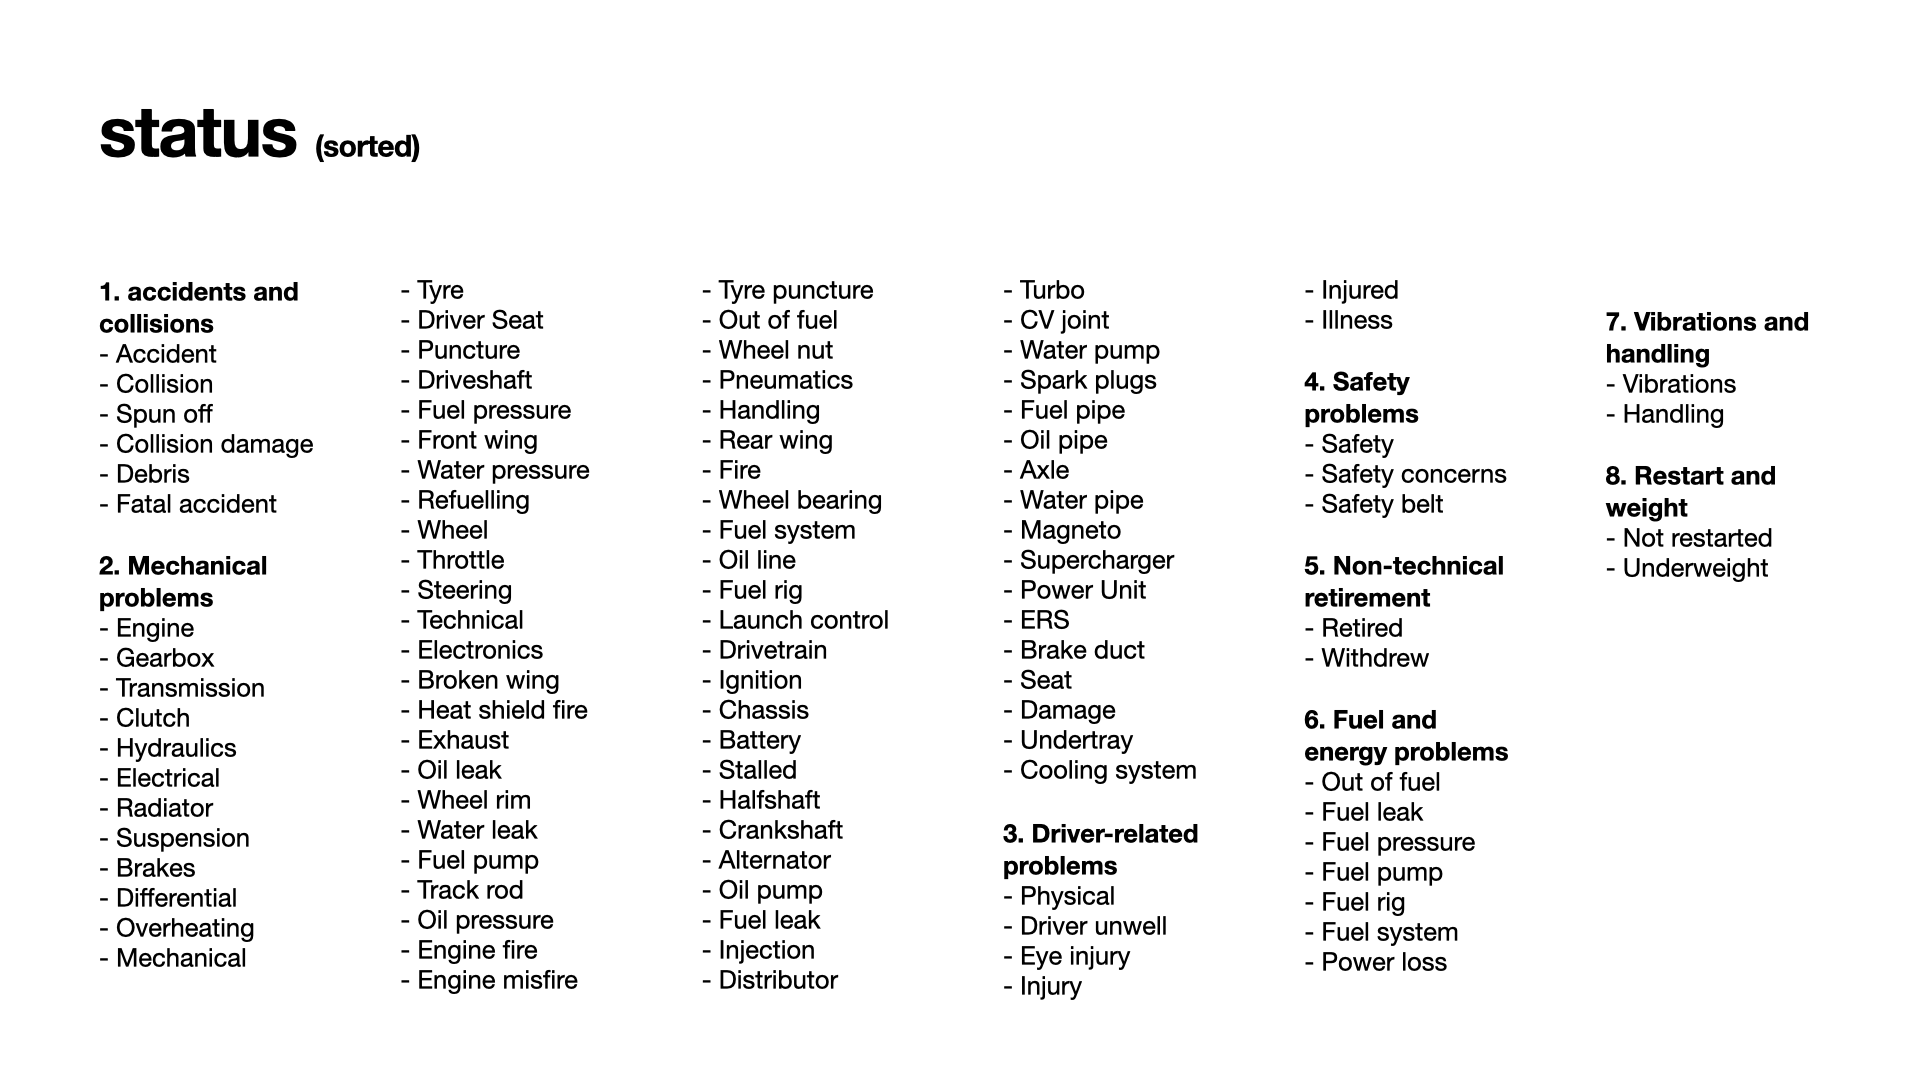
As there was still a lot of data, I have further reduced the existing results. For the incidents, I only kept the cases that led to failures on the car, by the driver or by the racing team. The statuses were then divided into individual groups.
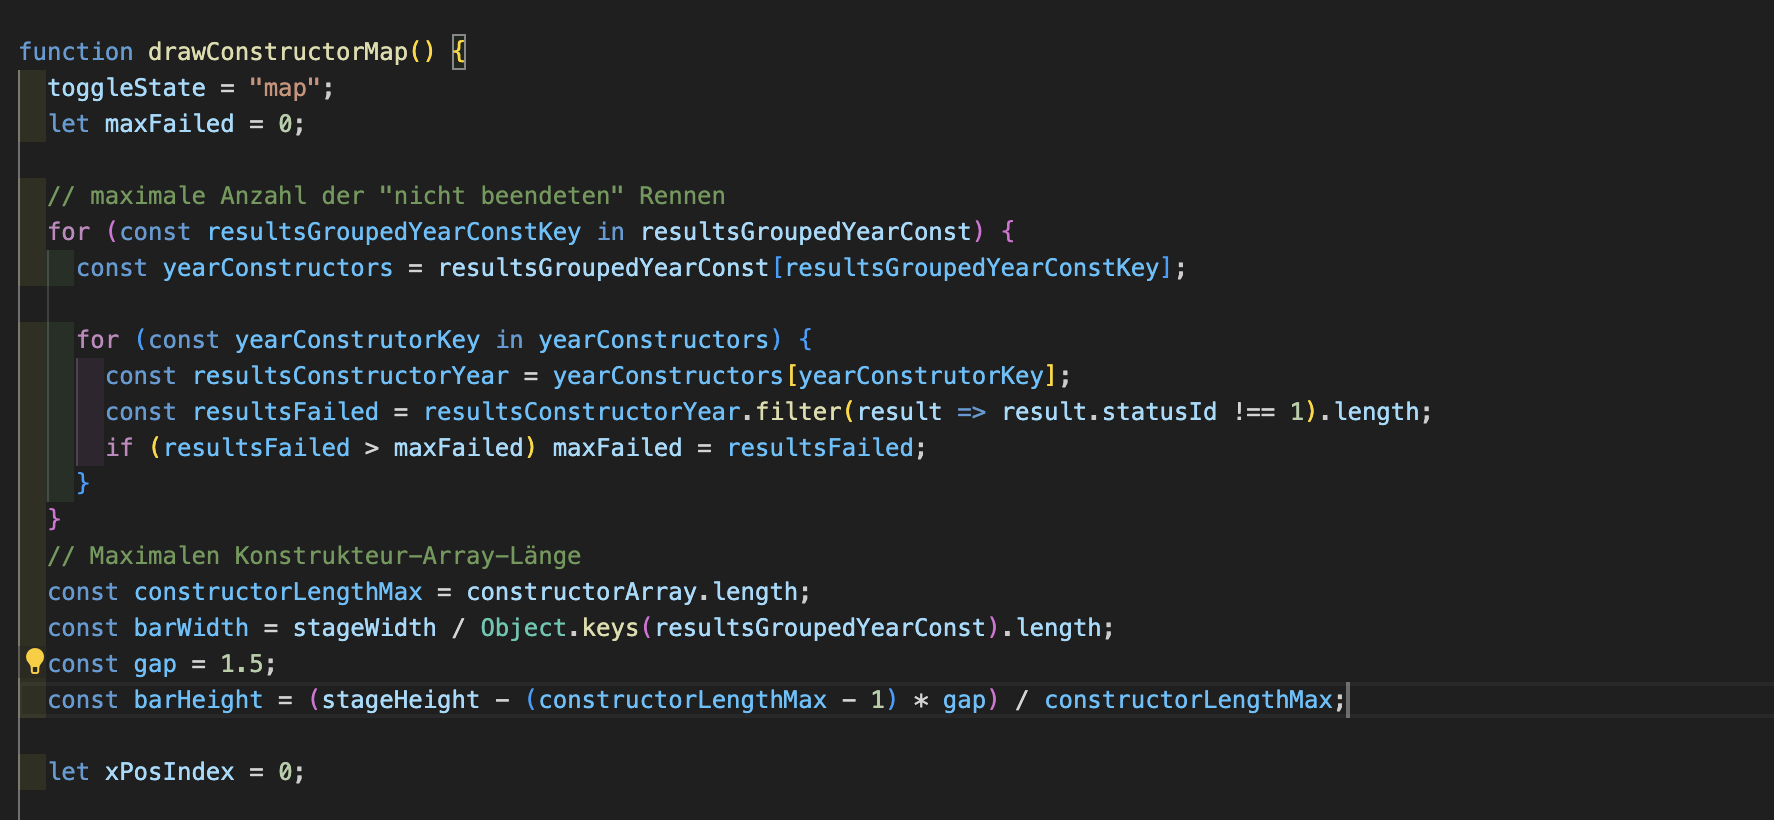
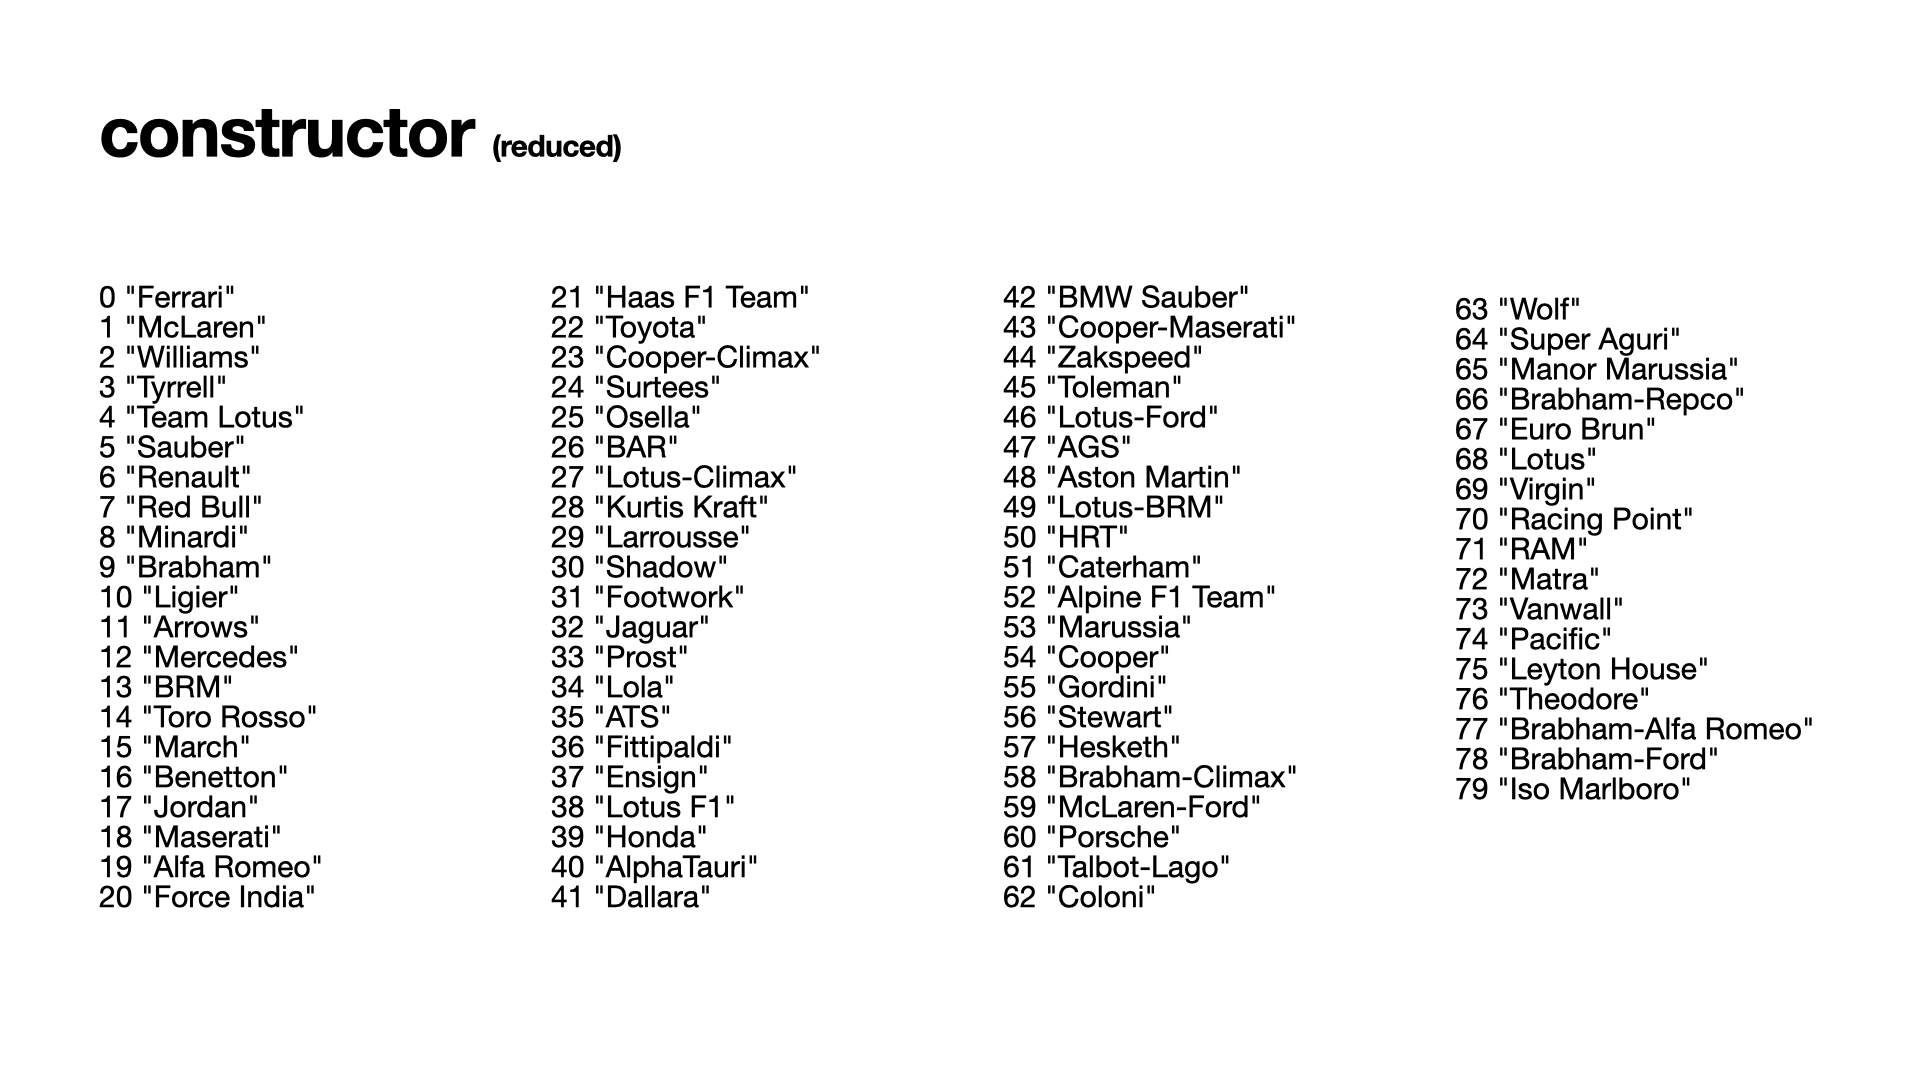
For the constructors, I filtered the data sets so that they had to have at least 55 statuses in order to be included in the data visualisation. The constructors were sorted by frequency.
The following libraries were used for the visualisation in javascript:
- gmynd.js: used for data visualisation and processing functions
- jquery.min.js: used for event handling, animations and HTML
- Treemap.js: used for the implementation of the treemap