final results
The data visualization covers Formula 1, particularly incidents on race tracks from 1950 to 2023. It provides an overview of the individual incidents during races and highlights the developments of various constructors.

⬑
quick explanation of the general topic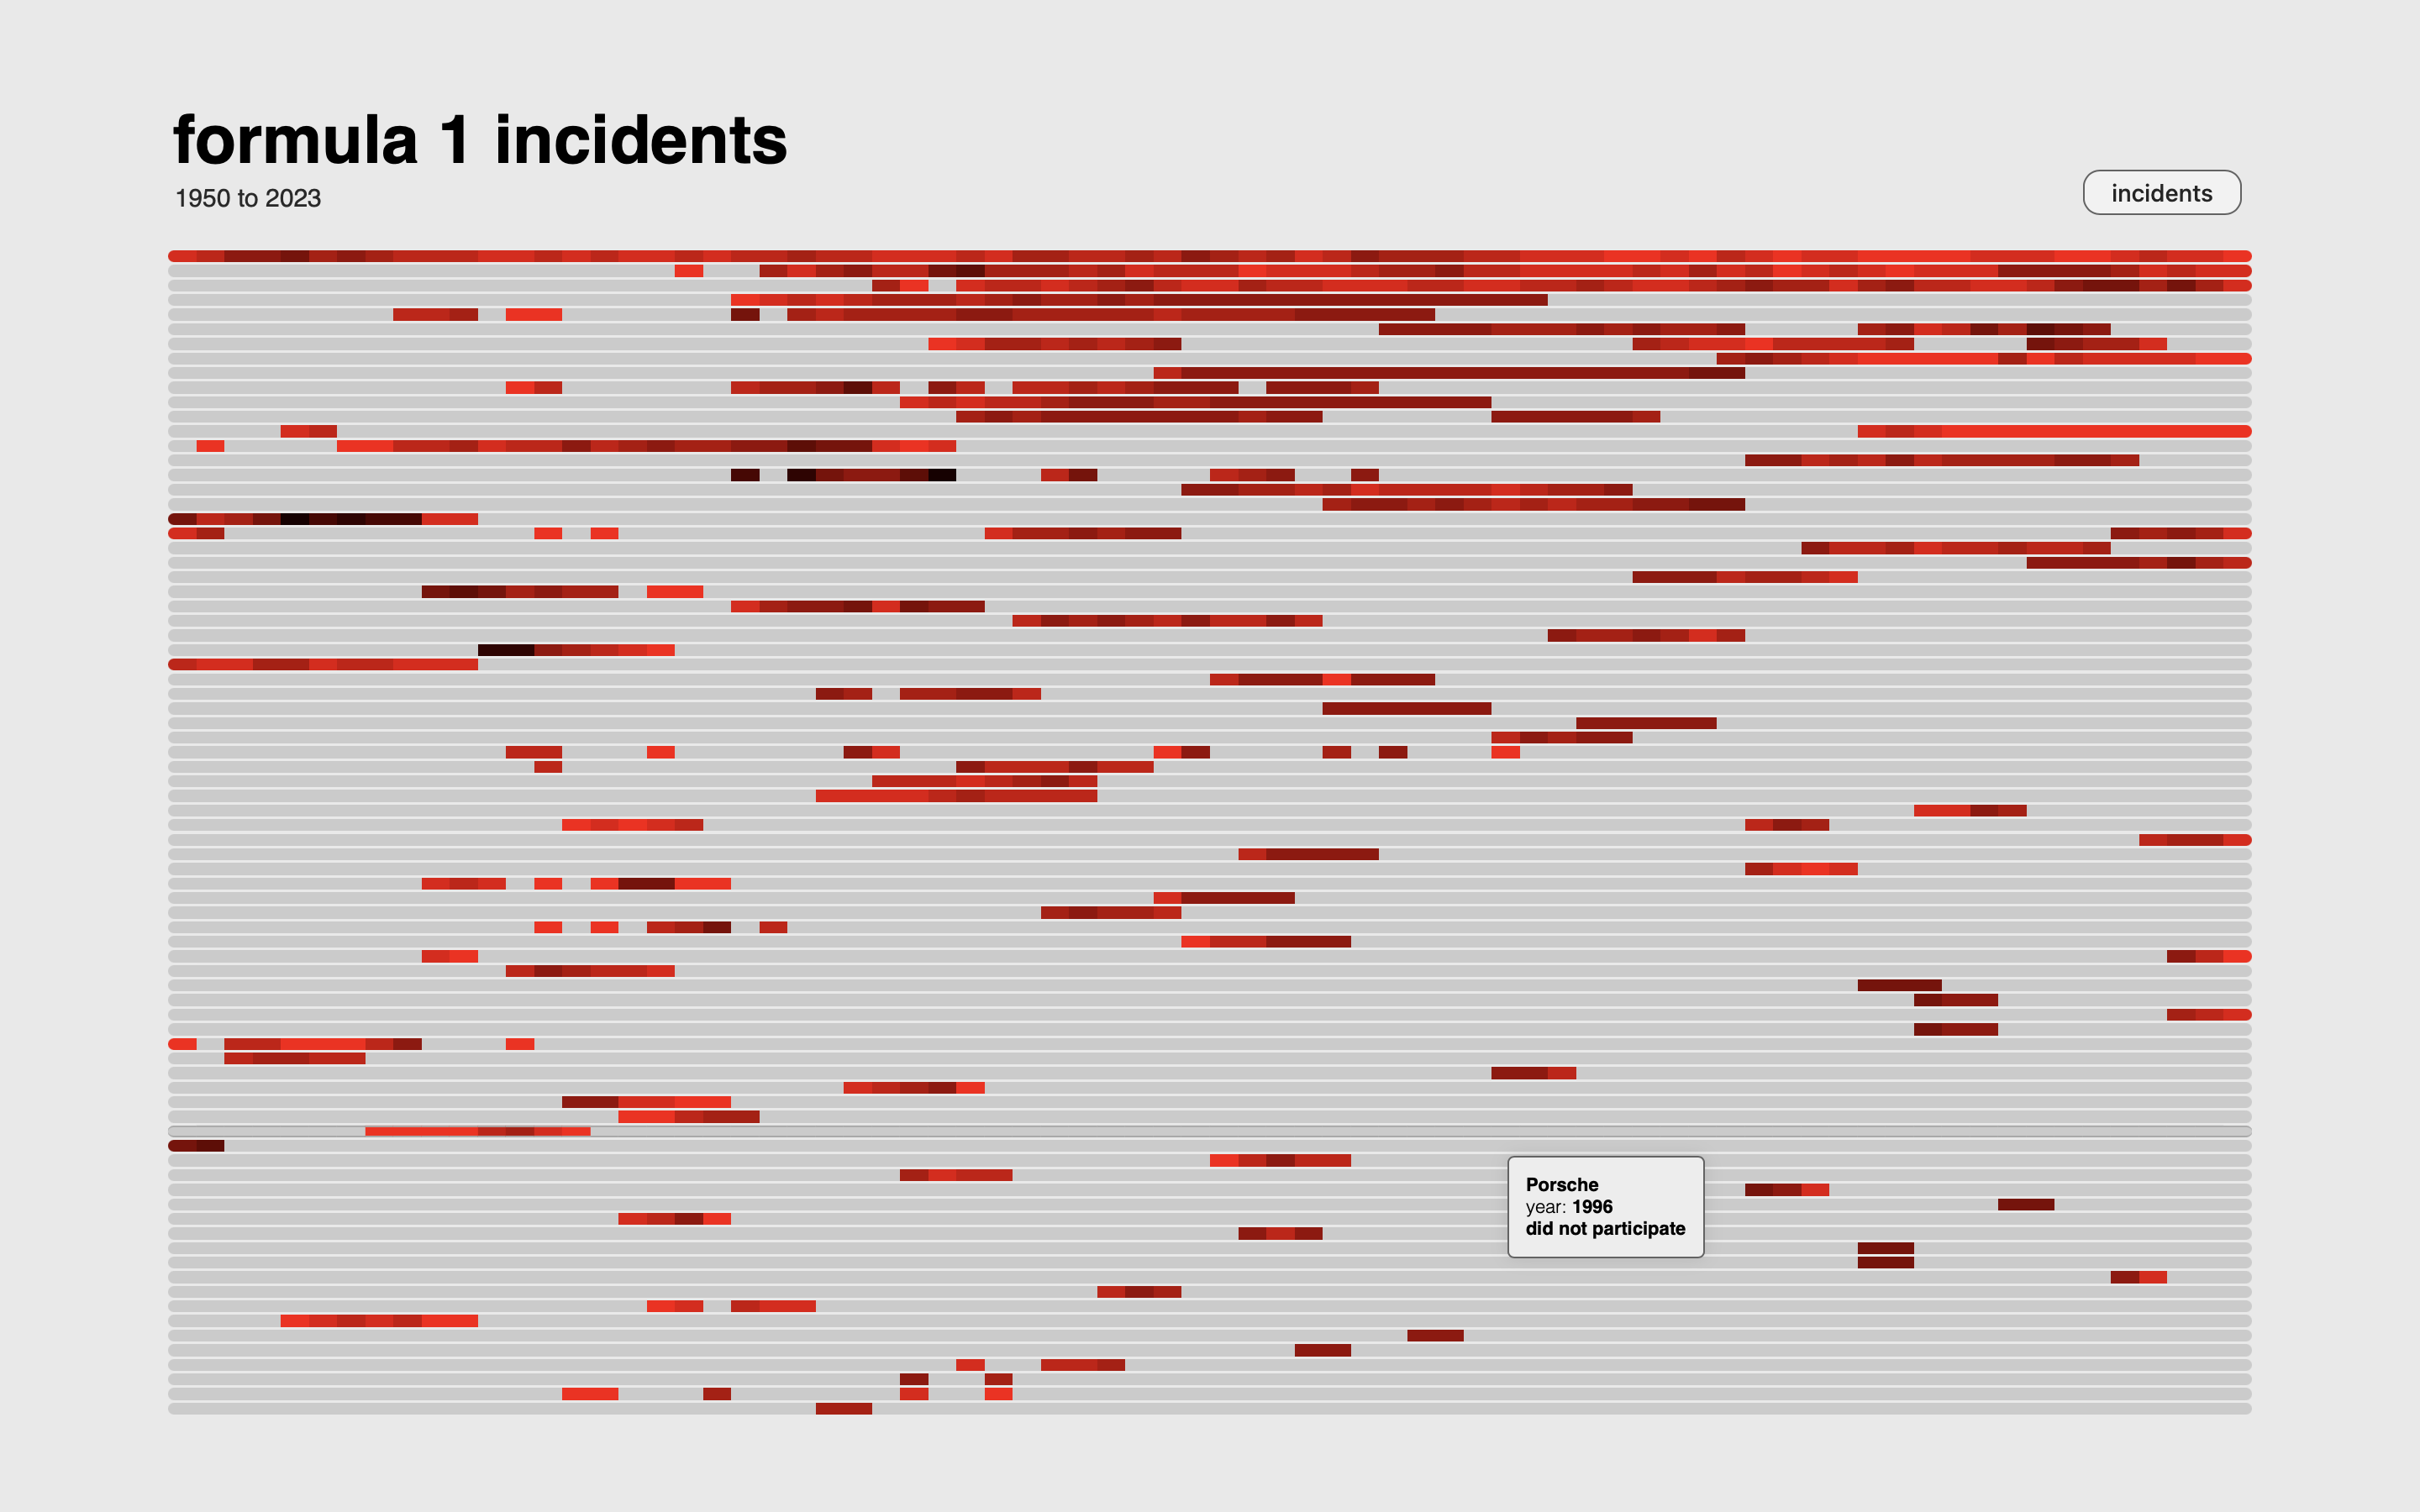
⬑
screen 1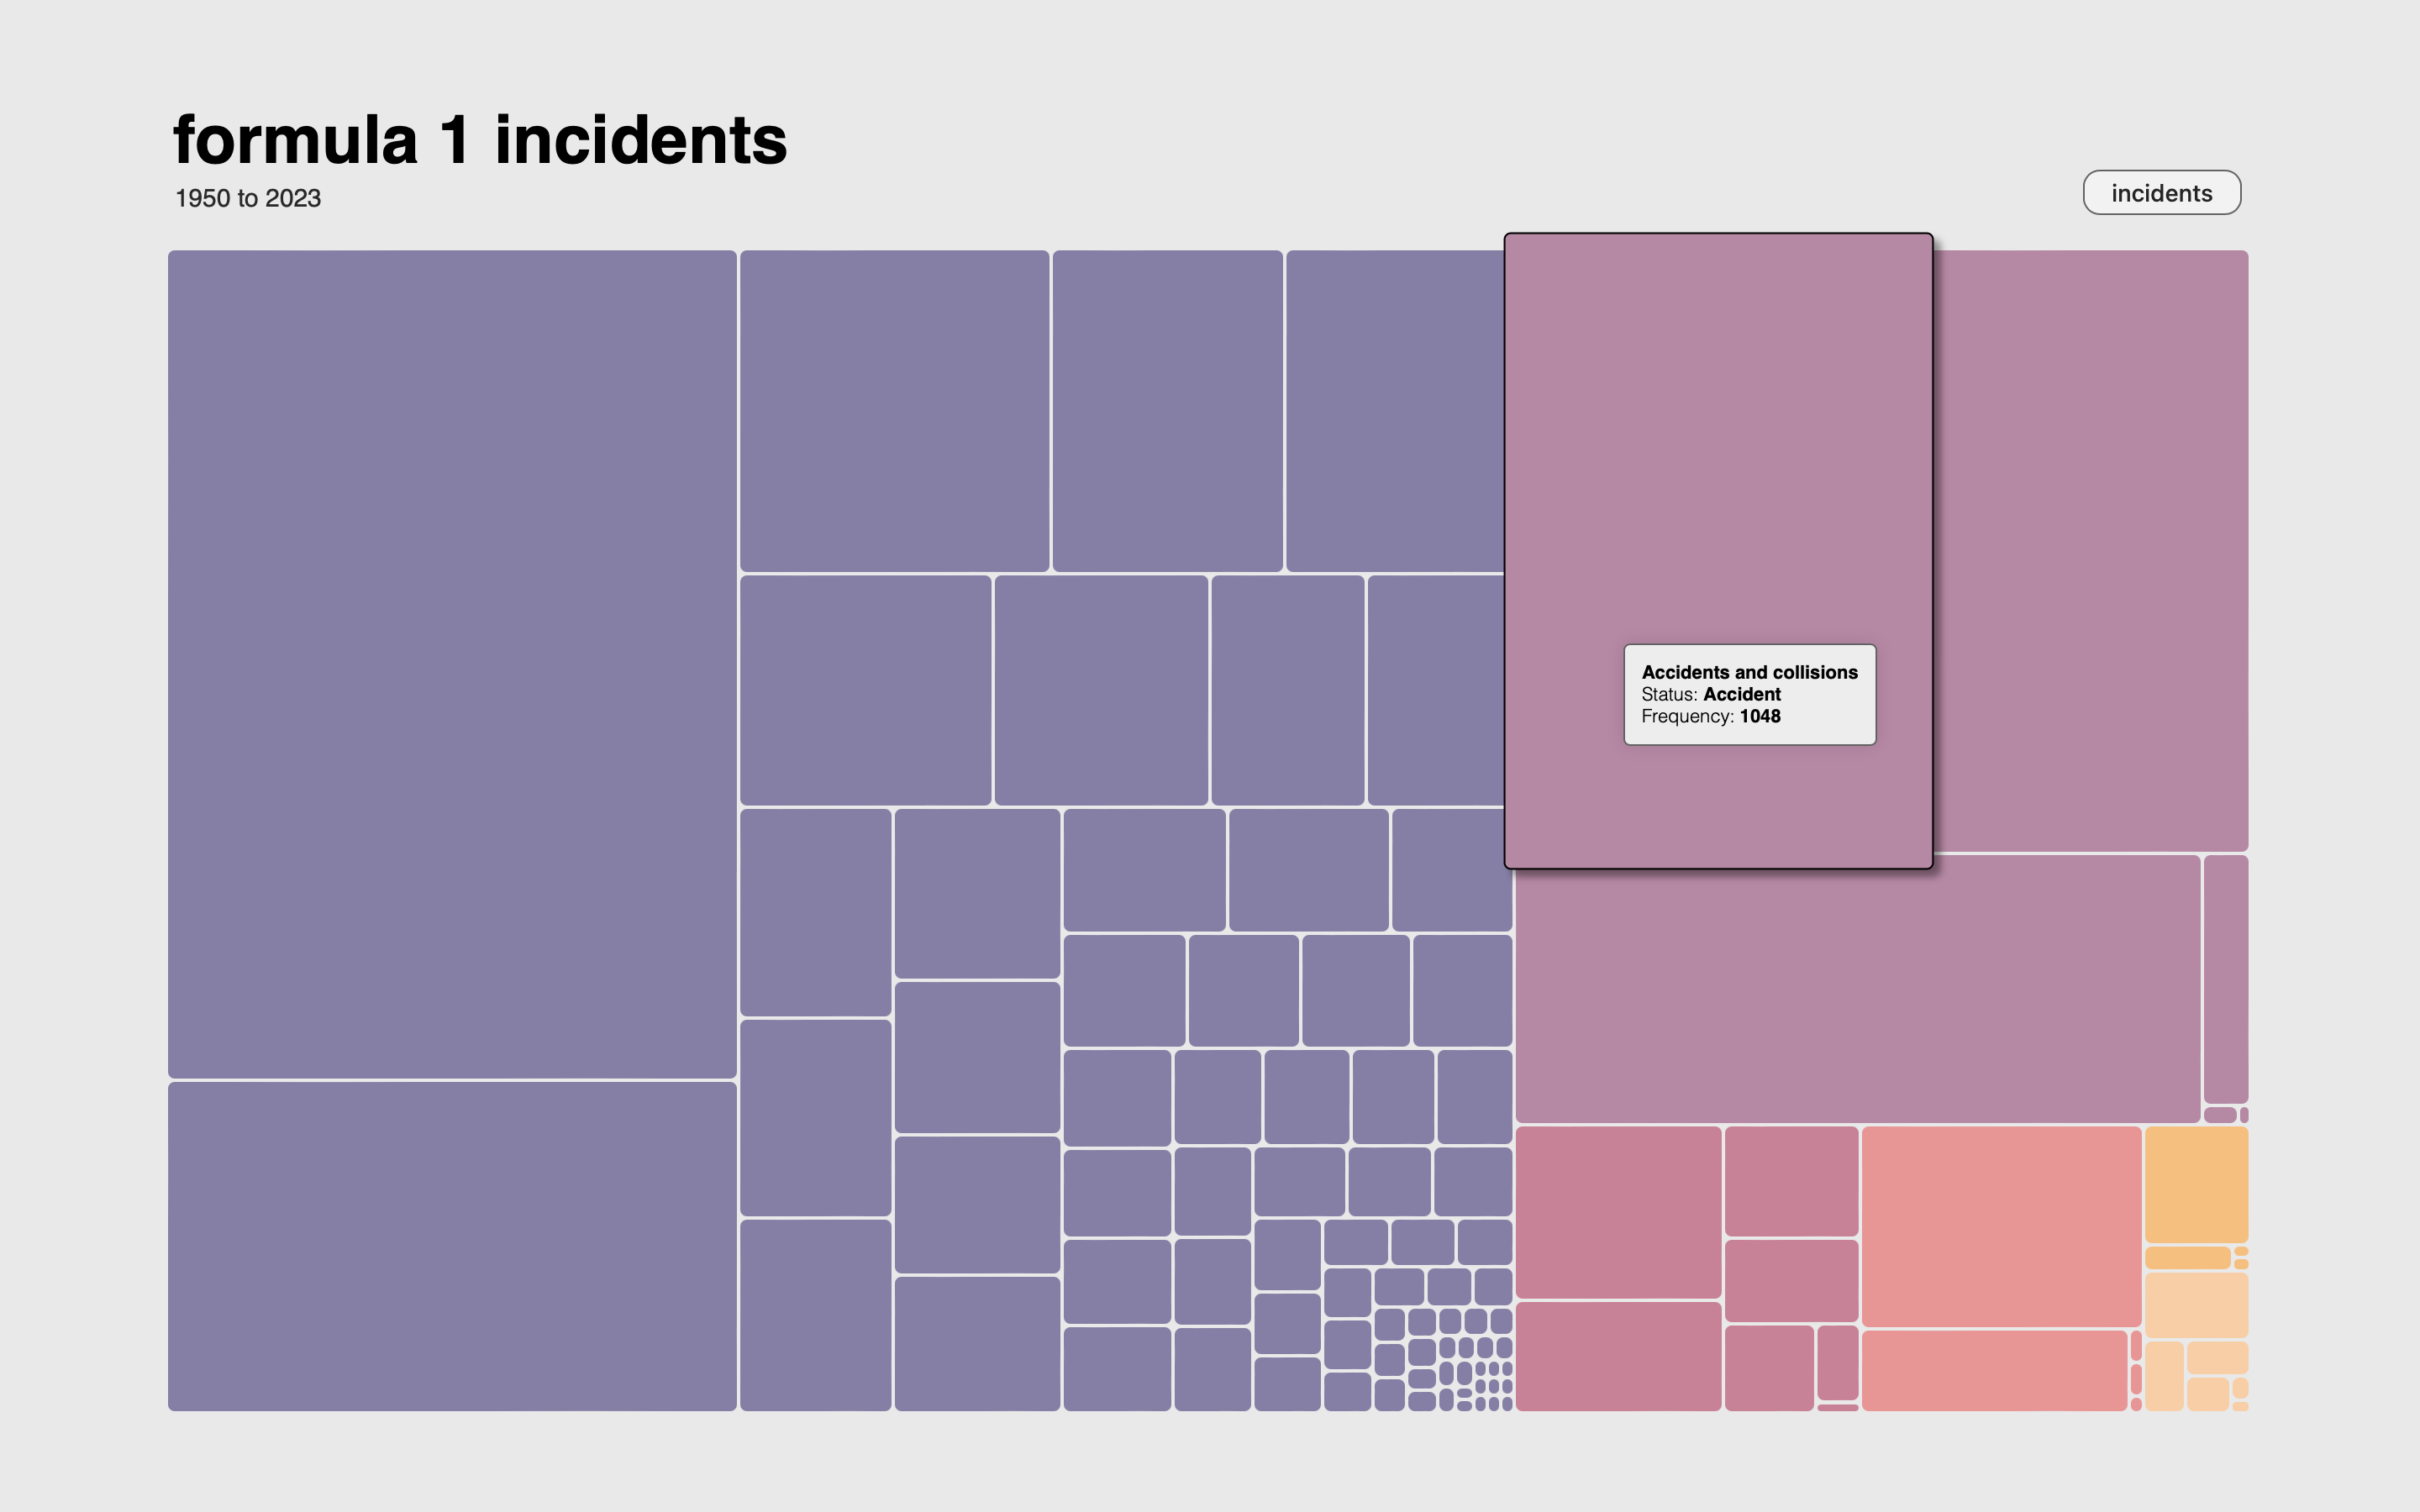
⬑
screen 2Here is the visualisation in video form:
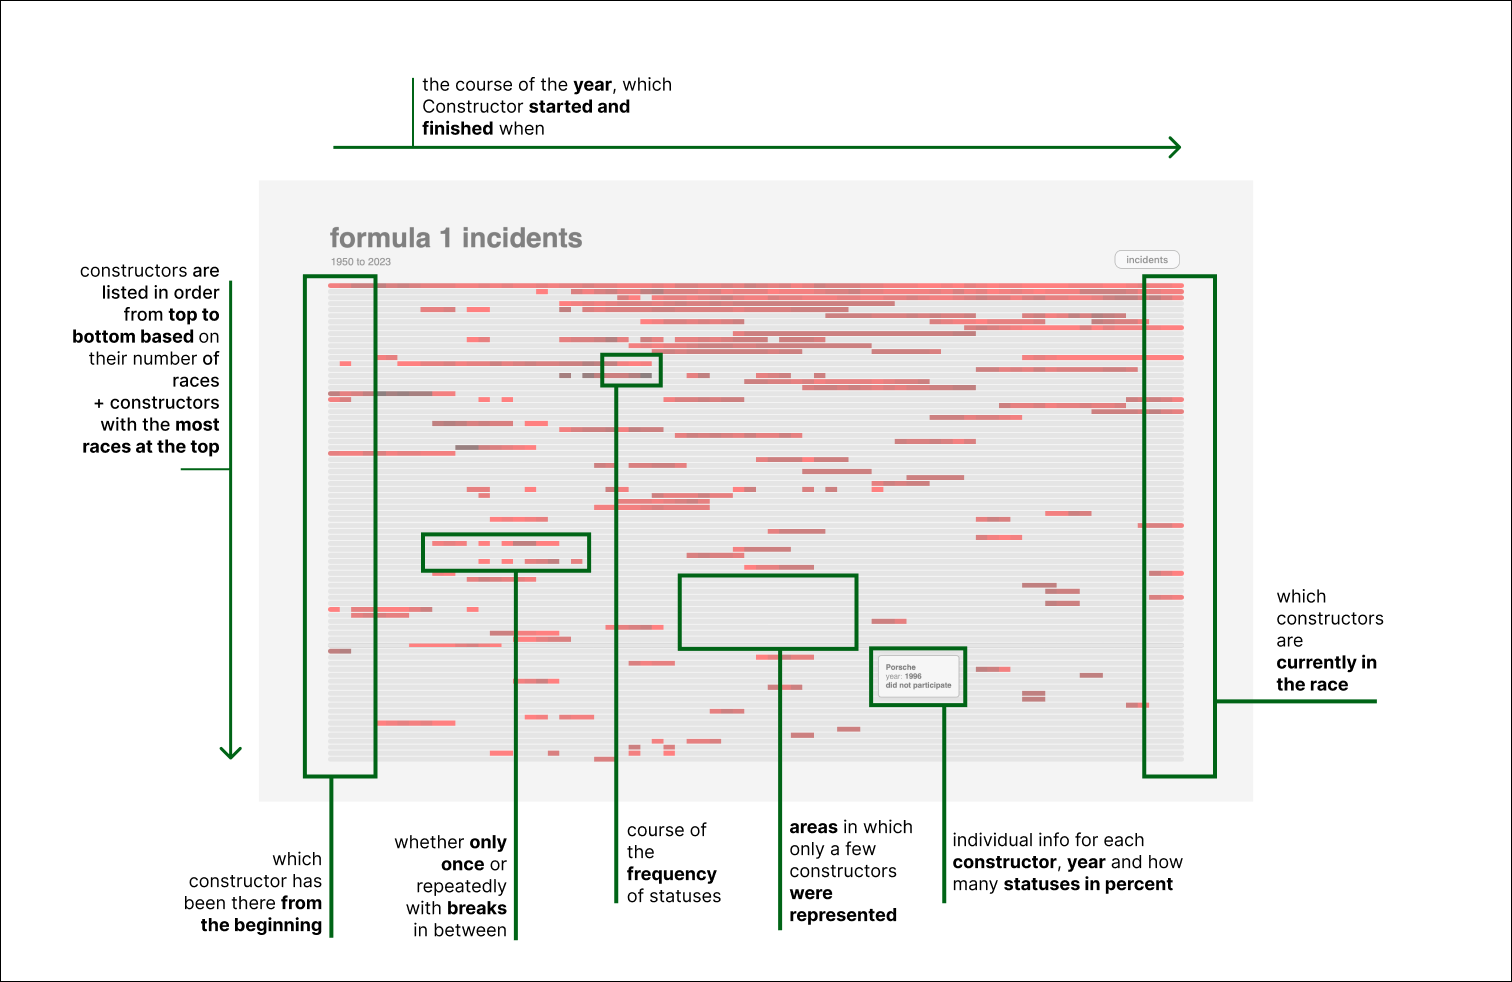
findings
⬑
findings screen 1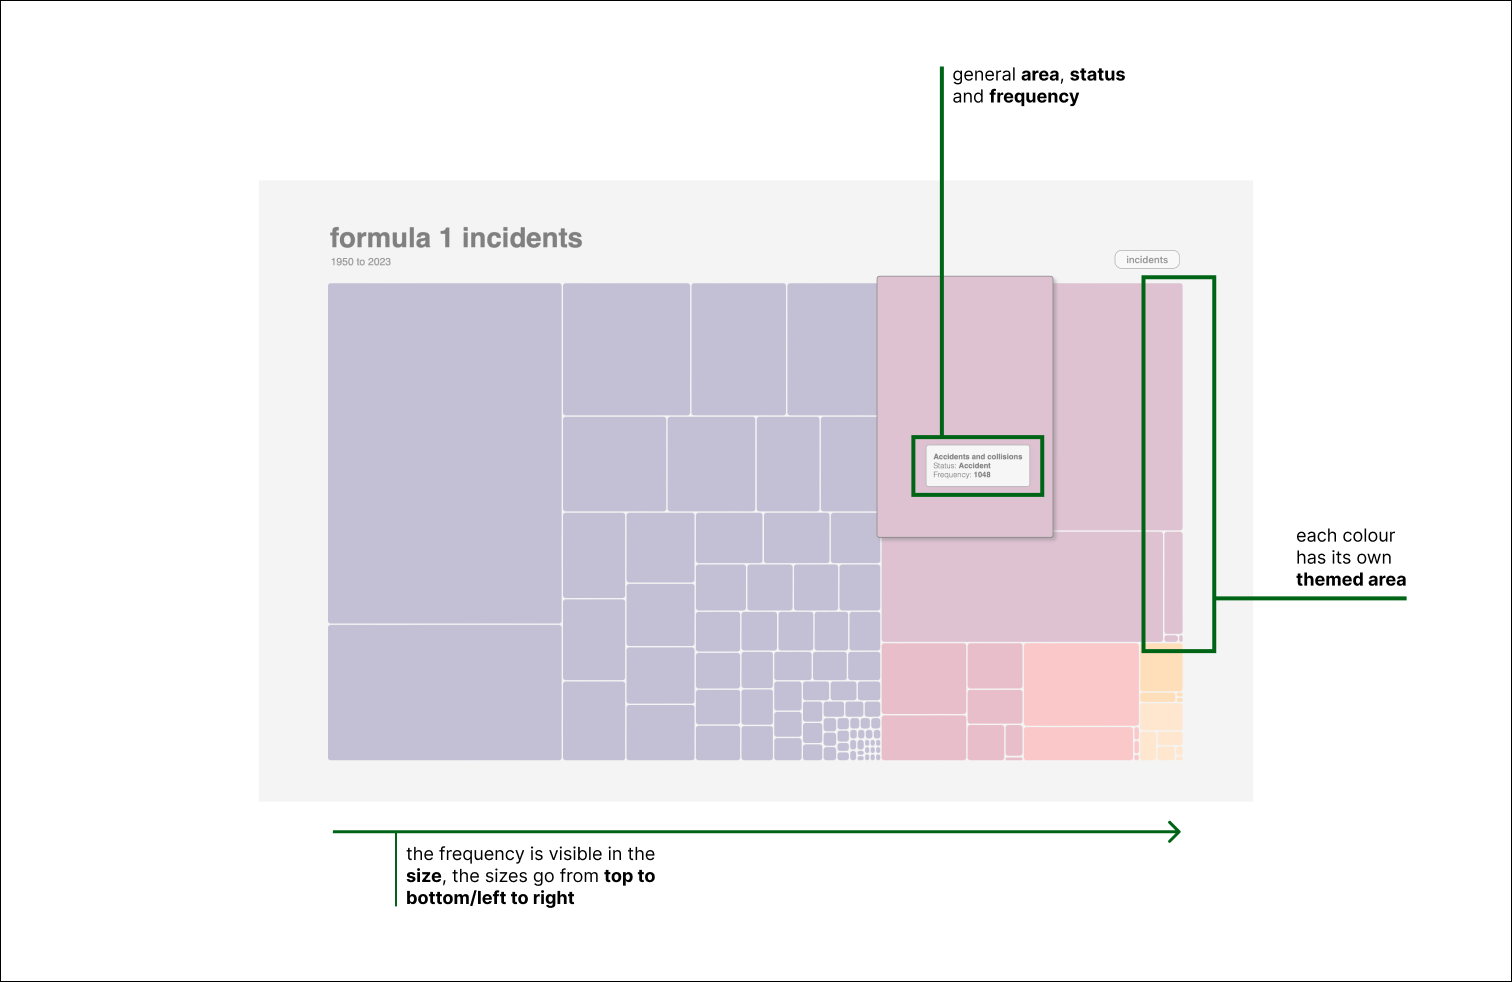
⬑
findings screen 2