First concepts
This was my first concept inspired by some diagrams we saw during our lessons. I wanted to split the data amongst the five oceans to give a nice overview of each one. I also thought of splitting it into realms, an even more precise localization of the data. Since this topic is familiar to me i made some visualizations that i thought would look with the data i assumed the dataset would provide to me. But damn was i off with my assumptions….
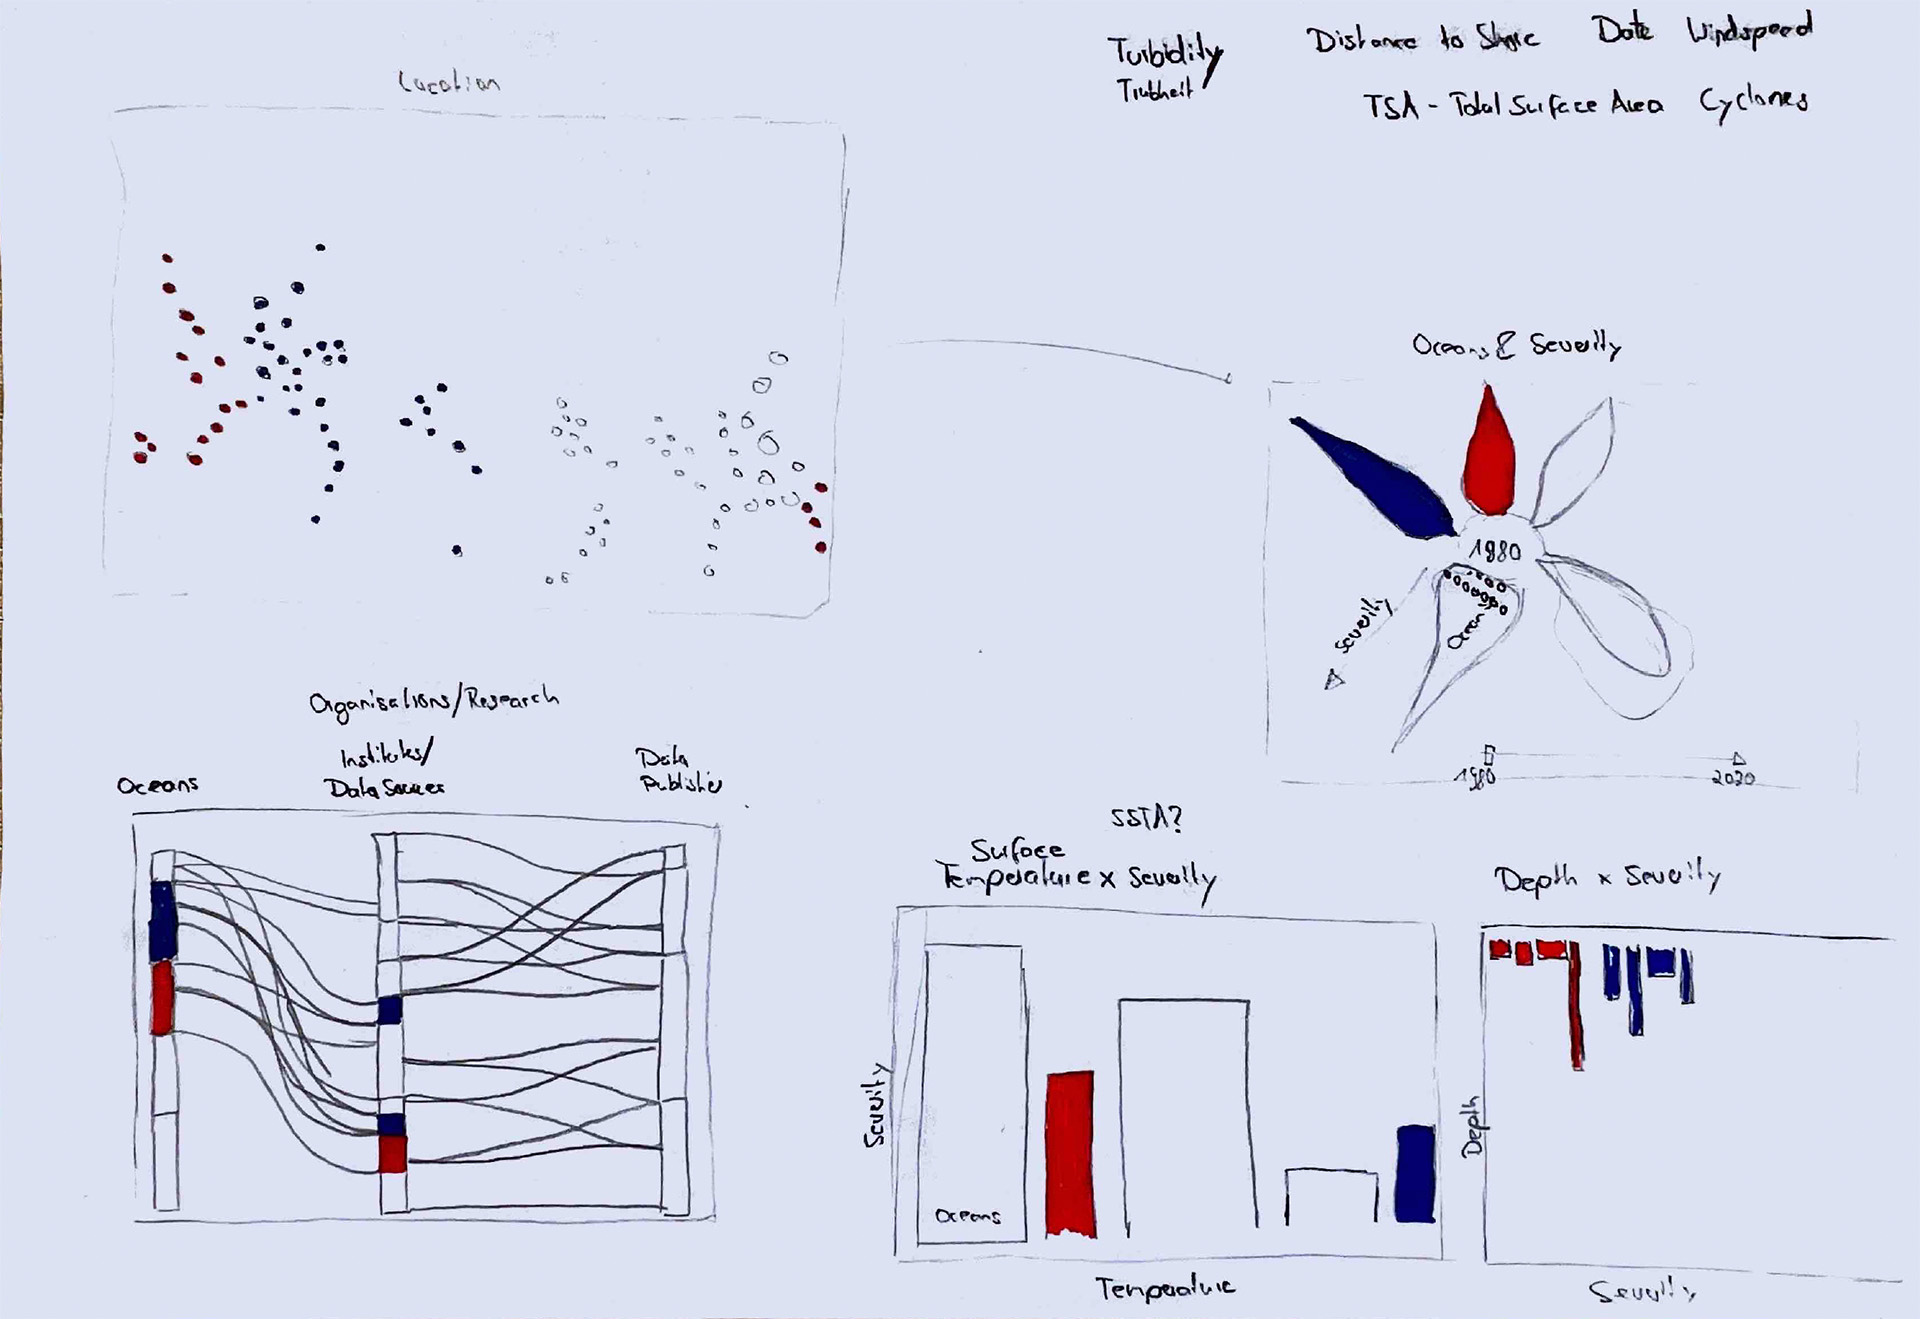
Diagram types:
- heat-map or map with location
- sunburst diagram with a ray for each ocean and how bleached it is
- data flow chart with focus where the data are collected
- bar charts or later scatter plots for correlations between values